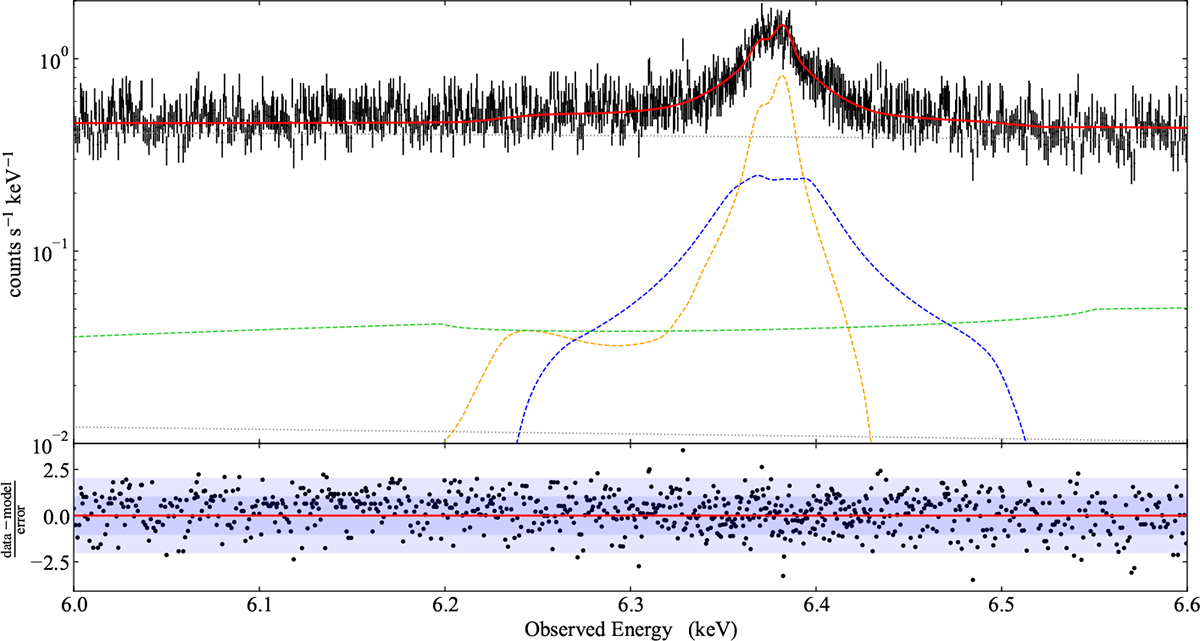
Fig. 6.
Download original image
Top: best fit model to XRISM-resolve data (black points). The solid red line shows the total model, while the dashed and dotted lines show the components. These are: scattered and primary continuum (grey dotted lines), MYTORUS emission line from Compton thick slow-moving material (orange dashed line), XWINDFE emission line for a wind inwards of the BLR (blue dashed line), and DISKLINE emission line from the inner disc (green dashed line). Bottom: data-model residuals, normalised by the data errorbar. The shaded blue bands show the 1σ (dark) and 2σ (light) deviation.
Current usage metrics show cumulative count of Article Views (full-text article views including HTML views, PDF and ePub downloads, according to the available data) and Abstracts Views on Vision4Press platform.
Data correspond to usage on the plateform after 2015. The current usage metrics is available 48-96 hours after online publication and is updated daily on week days.
Initial download of the metrics may take a while.