Fig. 7.
Download original image
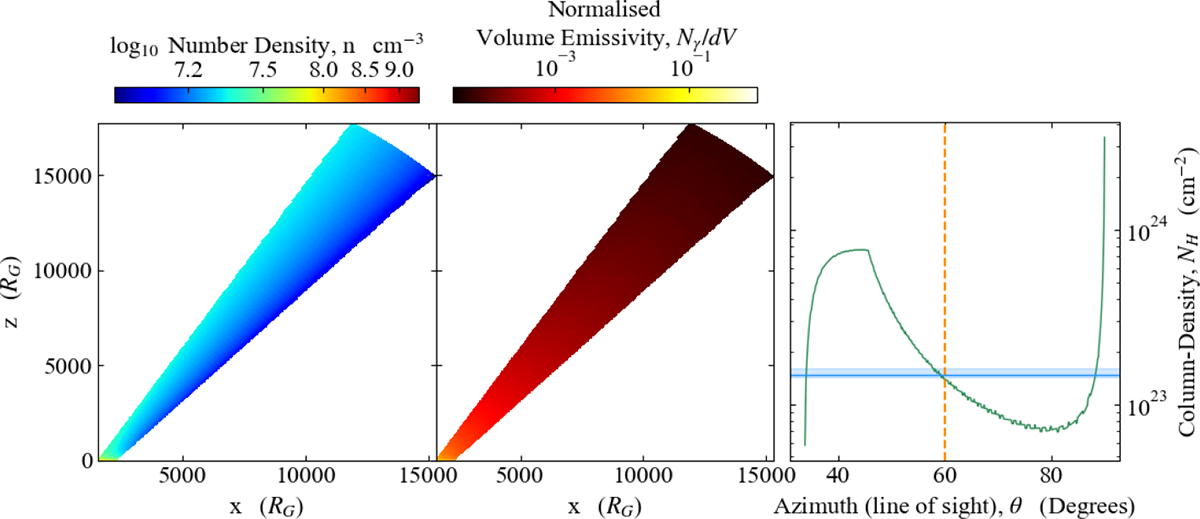
Left and middle: wind density (left) and emissivity (right) profiles corresponding to the best fit XWINDFE model fit to the XRISM-resolve data (Fig. 6). It is clear that the high density and emissivity regions are concentrated towards the base of the wind. However, some additional contributions from larger scale regions in the wind give the ‘narrow-er’ core seen in the line profile in Fig. 6. Right: column-density profile as a function of azimuth through the wind (green line). The drop at ∼50° corresponds to the point where sight-lines do not reach the outer radius of the wind, rather cutting through the central regions. The vertical dashed orange line indicates the observer inclination for NGC 4151, while the solid blue horizontal line indicates the column-density of the PCFABS component as inferred from the continuum fit. The agreement here is remarkable given that the XWINDFE fit did not use any prior constraints on line-of-sight column-density.
Current usage metrics show cumulative count of Article Views (full-text article views including HTML views, PDF and ePub downloads, according to the available data) and Abstracts Views on Vision4Press platform.
Data correspond to usage on the plateform after 2015. The current usage metrics is available 48-96 hours after online publication and is updated daily on week days.
Initial download of the metrics may take a while.