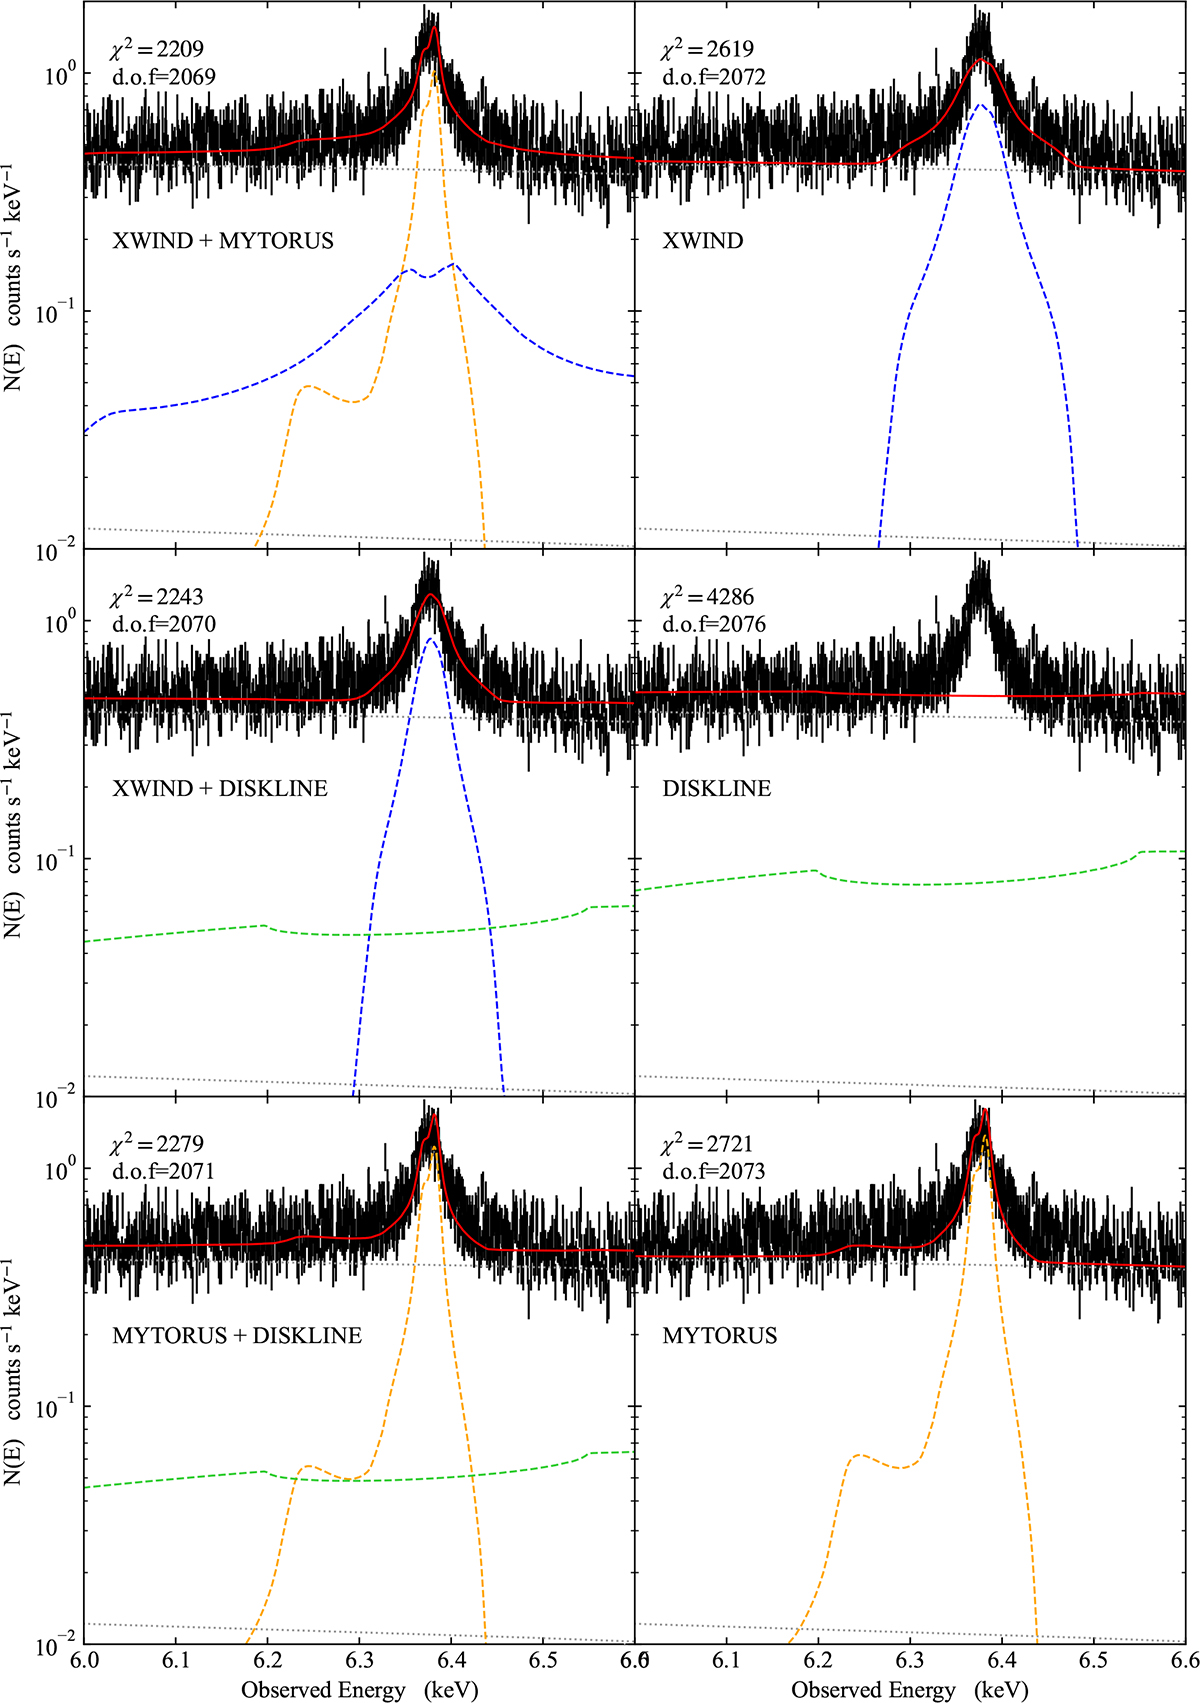
Fig. C.1.
Download original image
Model fits to XRISM-resolve for subsets of our total line-profile model, to highlight the significance of each component. As with the main model in Fig. 6 these have been fit over the 5.0-6.6 keV energy range. The left column shows the case for a two-component model to the Fe-Kα complex, while the right shows a single component scenario. The relevant model components (shown as dashed coloured lines) are XWINDFE (blue), MYTORUS (orange), and DISKLINE (green). In all cases, these result in a statistically significantly worse fit than our fiducial three component model for the Fe-Kα complex.
Current usage metrics show cumulative count of Article Views (full-text article views including HTML views, PDF and ePub downloads, according to the available data) and Abstracts Views on Vision4Press platform.
Data correspond to usage on the plateform after 2015. The current usage metrics is available 48-96 hours after online publication and is updated daily on week days.
Initial download of the metrics may take a while.