Open Access
Fig. 1
Download original image
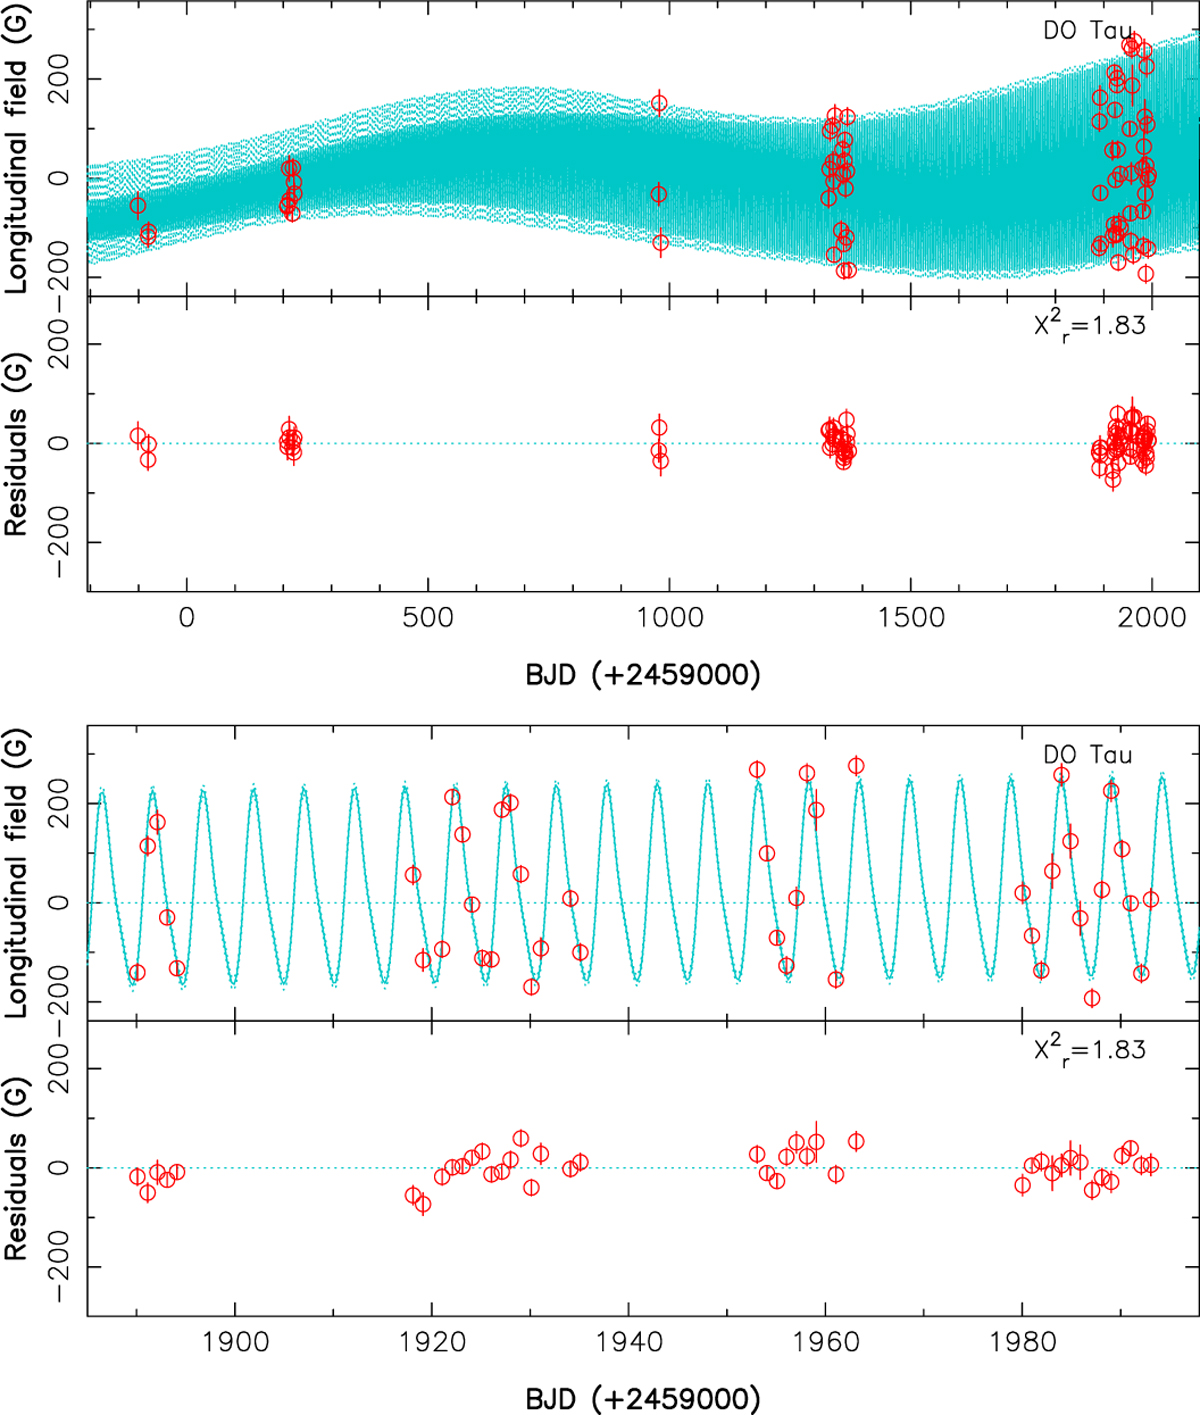
Longitudinal magnetic field Bℓ (red dots), and QP GPR fit to the data (full cyan line) with corresponding 68% confidence intervals (dotted cyan lines). The bottom panel zooms-in on the 2025 data. The residuals, shown in the bottom plot of each panel, have an rms of 25 G (![]() ).
).
Current usage metrics show cumulative count of Article Views (full-text article views including HTML views, PDF and ePub downloads, according to the available data) and Abstracts Views on Vision4Press platform.
Data correspond to usage on the plateform after 2015. The current usage metrics is available 48-96 hours after online publication and is updated daily on week days.
Initial download of the metrics may take a while.