| Issue |
A&A
Volume 708, April 2026
|
|
|---|---|---|
| Article Number | A230 | |
| Number of page(s) | 19 | |
| Section | Stellar atmospheres | |
| DOI | https://doi.org/10.1051/0004-6361/202558694 | |
| Published online | 09 April 2026 | |
Monitoring the magnetospheric accretion of the classical T Tauri star DO Tau with SPIRou
1
Univ. de Toulouse, CNRS, IRAP,
14 avenue Belin,
31400
Toulouse,
France
2
Leiden Observatory, Leiden University,
Niels Bohrweg 2,
2333 CA
Leiden,
The Netherlands
3
Univ. Grenoble Alpes, CNRS, IPAG,
38000
Grenoble,
France
4
Departamento de Física – ICEx – UFMG, Av. Antônio Carlos,
6627, 30270-901
Belo Horizonte,
MG,
Brazil
5
Department of Astronomy, University of Geneva,
Chemin Pegasi, 51,
Versoix
1290,
Switzerland
6
Dublin Institute for Advanced Studies, Astronomy & Astrophysics Section,
31 Fitzwilliam Place,
Dublin
D02 XF86,
Ireland
★ Corresponding author: This email address is being protected from spambots. You need JavaScript enabled to view it.
Received:
19
December
2025
Accepted:
22
February
2026
Abstract
We present observations of the classical T Tauri star DO Tau collected with the near-infrared SPIRou spectropolarimeter and precision velocimeter at the Canada-France-Hawaii Telescope from early 2020 to late 2025. Circularly polarized Zeeman signatures were clearly detected at most epochs in the atomic spectral lines of DO Tau, yielding longitudinal magnetic fields of up to 280 G modulated with a period of 5.128 ± 0.002 d which we identified as the rotation period of DO Tau. Applying Zeeman-Doppler imaging to the SPIRou data recorded in 2021, 2024 and 2025, we found that DO Tau hosts an unusual large-scale magnetic field that is weaker, less poloidal, more inclined to the rotation axis, and varies more rapidly with time than those of previously studied T Tauri stars, possibly as a result of intense accretion between the inner disk and the stellar surface. The dipole component of this large-scale field of about 0.2-0.3 kG even flipped polarity toward the end of our observing campaign, making DO Tau the first T Tauri star for which a magnetic polarity reversal is reported. The magnetospheric gap surrounding the central star was quite compact, extending to ≃1.6 R* (0.014 au) as a result of the strong accretion rate (log Ṁ = −7.7 M⊙ yr−1), with the inner accretion disk being warped by the tilted stellar magnetic field. Radial velocity variations suggest the presence of a close-in planet of a few M♃ or a density structure in the inner accretion disk at an orbital period of 21 d (corresponding to 0.12 au), which might be linked to the wiggle in the jet axis of DO Tau.
Key words: techniques: polarimetric / stars: formation / stars: imaging / stars: low-mass / stars: magnetic field / stars: individual: DO Tau
© The Authors 2026
 Open Access article, published by EDP Sciences, under the terms of the Creative Commons Attribution License (https://creativecommons.org/licenses/by/4.0), which permits unrestricted use, distribution, and reproduction in any medium, provided the original work is properly cited.
This article is published in open access under the Subscribe to Open model. This email address is being protected from spambots. You need JavaScript enabled to view it. to support open access publication.
1 Introduction
With an age of only a few Myr, pre-main-sequence (PMS) low-mass T Tauri stars, and in particular the classical T Tauri stars (cTTSs) that still accrete material from their accretion disk, are key targets for investigating the late phases of star formation and the multiple physical processes that take place in the close stellar environment, including magnetospheric accretion, outflows and jets (e.g., Romanova et al. 2021). They are also ideal objects for constraining models of planetary formation and migration at a stage for which very little observational material is yet available.
A few dozen weakly accreting cTTSs have been observed at multiple epochs to address these points. We used spectropo-larimetry to characterize the magnetic field of the central star and its interactions with the inner accretion disk, and velocimetry to investigate the potential presence of close-in massive companions at the outer edge of the stellar magnetospheres (e.g., Zaire et al. 2024; Donati et al. 2024d,b), in particular those transiting their host stars (Barber et al. 2024; Donati et al. 2025b). These results, some from data obtained with the nearinfrared (nIR) SPIRou spectropolarimeter and velocimeter at the Canada-France-Hawaii Telescope (CFHT), used ZeemanDoppler imaging (ZDI) to reconstruct the large-scale magnetic topologies of the observed cTTSs. These data also clarify how magnetospheric accretion proceeds, emphasizing the role of magnetic fields in controlling the rotation of cTTSs (Romanova et al. 2025).
Very few such studies exist for cTTSs that strongly accrete material from their disks. Characterizing such an evolution phase, through which all PMS stars must go at some point (e.g., Fischer et al. 2023), is essential for a thorough understanding of star and planet formation. The effect of accretion flows on the formation of low-mass stars (e.g., Geroux et al. 2016), and more specifically, on the internal structure, convection patterns, dynamo processes, and large-scale magnetic fields, must be investigated to determine how these fields interact with accretion, outflows, and jets from the inner disks (Blinova et al. 2016), and how they affect stellar rotation (e.g., Amard & Matt 2023). In addition, detecting close-in massive planets and characterizing how they migrate within the disk and trigger enhanced accretion (Romanova et al. 2026) is essential for better constraining theoretical models at early stages of planet formation.
To address these points we ran a long-term observing program on DO Tau, a low-mass cTTS with a high accretion rate, using SPIRou at the CFHT and collected spectra over 5.7 years. After recalling the main parameters of DO Tau and detailing the SPIRou observations we collected in Sects. 2 and 3, we model the temporal evolution of its magnetic field with Gaussian process regression (GPR) and ZDI in Sects. 4 and 5, and we investigate in Sect. 6 whether its radial velocity (RV) variations reveal the presence of a close-in massive planet. In Sect. 7 we study what the emission lines tell us about magnetospheric accretion taking place in DO Tau, and we summarize the results in Sect. 8.
2 The T Tauri star DO Tau
Located in the Taurus star-forming region (in the C7-L1527 spatial subgroup, aged 2.59 ± 0.75 Myr; Krolikowski et al. 2021) at a distance of 138.52 ± 0.68 pc from the Earth (Gaia Collaboration 2020), DO Tau is a low-mass M1 cTTS undergoing intense accretion as signaled by strong emission lines across its spectrum (Alcalá et al. 2021; Sousa et al. 2023). It is surrounded by a compact accretion disk of several dozen au that is inclined at 27.6 ± 0.3° to the line of sight (Long et al. 2019), and whose inner region is the source of a CO outflow and a bipolar jet (e.g., Fernández-López et al. 2020; Erkal et al. 2021). Its complex circumstellar environment, featuring arms and streams, suggests an unusual evolution that might be caused by interactions with the nearby cTTS HV Tau or with remnant material from the star formation process (Winter et al. 2018; Huang et al. 2022). The morphology of the jet, and in particular the axis wiggle in both lobes, also suggests that the inner disk of DO Tau, from which the jet originates, might host a massive planet on an inclined orbit or be warped by a variable magnetic field (Erkal et al. 2021).
As DO Tau accretes material from the inner regions of its accretion disk at a relatively high rate, its spectrum is subject to veiling, i.e., a dilution of its photospheric lines that results from the addition of a mostly featureless spectral contribution from warm accretion features (strongest in the blue) and from the inner edge of the accretion disk (strongest in the red). Photospheric spectral lines of DO Tau can thus be weaker by two to seven times than expected from a weak-line TTS of the same spectral type (Alcalá et al. 2021, see also Sect. 7), rendering fundamental parameters hard to estimate precisely. Several studies quoted values inferred from high-resolution spectra, e.g., Alcalá et al. (2021) who derived an effective temperature of Teff = 3694 ± 104 K from optical spectra and López-Valdivia et al. (2021) who reached similar results with larger error bars from nIR spectra (Teff = 3704 ± 350 K and log g = 3.44 ± 0.50 dex). A study from low-resolution spectra aimed at explaining the IYJ continuum excess emission of cTTSs suggested a much lower effective temperature (Teff = 2947 ± 25 K; Pérez Paolino et al. 2025). Our own analysis of the least veiled SPIRou spectra yielded an intermediate value (Teff = 3450 ± 50 K and log g = 3.6 ± 0.1 dex, see Sect. 3), which is more or less consistent with previous measurements from high-resolution spectroscopy.
The velocity field in the disk derived from molecular line ALMA images indicated a dynamical mass of M* = 0.54 ± 0.07 M⊙ for DO Tau (Braun et al. 2021), which, when it is coupled to our estimate of log g implied a stellar radius of R* = 1.9 ± 0.2 R⊙ and a logarithmic luminosity of log L*/L⊙ = −0.3 ± 0.2. The original evolutionary models of Feiden (2016) that include magnetic fields are able to reconcile our Teff and log g estimates with this mass measurement, yielding an age of 1.7 ± 0.5 Myr (consistent with that of the C7-L1527 Taurus subgroup). In their most recent version (where the surface magnetic field strength was updated at each model iteration to be equal to the pressure equipartition value; Feiden, private communication), the mass that best matches our measurements is 0.42 ± 0.05 M⊙, slightly lower than (but still compatible with) the dynamical mass estimate of DO Tau. The nonmagnetic models of Feiden (2016) and those of Baraffe et al. (2015) yield an even lower mass of 0.30-0.32 M⊙, which is inconsistent with the dynamical estimate. DO Tau is still fully convective according to the evolutionary models of Feiden (2016), although convection might be affected by strong accretion (Geroux et al. 2016).
Our spectropolarimetric observations of DO Tau with SPIRou (see Sects. 3 and 4) revealed that the stellar rotation period is Prot = 5.128 ± 0.002 d and the rotational broadening of spectral lines is v sin i = 13.0 ± 0.5 km s−1, implying an inclination angle i of the stellar rotation axis to the line of sight of i = 45 ± 8°, consistent with the inclination of the inner disk from interferometric measurements (Perraut et al. 2026). This is higher than the inclination of the outer disk and is an additional indication that the evolution history of DO Tau is complex and that its inner disk is warped. Table 1 lists the parameters we used.
DO Tau is known to exhibit significant Zeeman broadening of photospheric lines, which is attributed to small-scale magnetic fields at the surface of the star with an average strength <B> = 1.78 ± 0.85 kG (López-Valdivia et al. 2021). Zeeman signatures were also detected in the 588 nm He I line of DO Tau, demonstrating a magnetic field of 0.45-0.79 kG at the footpoints of the magnetospheric accretion funnels linking the star to the inner disk (Dodin et al. 2013).
Several studies estimated mass accretion at the surface of DO Tau, in most cases by exploiting accretion fluxes derived from several emission lines using calibrated scaling laws (Alcalá et al. 2017; Fiorellino et al. 2025). Measuring accretion fluxes in 16 emission lines from the UV to the nIR, Alcalá et al. (2021) obtained that log Ṁ = −7.73 ± 0.40 (with Ṁ in M⊙ yr−1). From SPIRou spectra (some in common with our study), Sousa et al. (2023) obtained a similar estimate (log Ṁ = −7.54 ± 0.30) using Paβ and Brγ alone. Along with the strong veiling, it demonstrates that DO Tau is one of the strongest cTTS accretors in its mass range (see Fig. 9 of Alcalá et al. 2021).
DO Tau was monitored by TESS in 2021 (September 6 to November 6, sectors 43 and 44) and 2023 (September 20 to November 11, sectors 70 and 71) and exhibited a chaotic and aperiodic light curve of amplitude ≃ 1 mag, consistent with the K2 light curve based on which DO Tau was classified as a burster with photometric variations mostly attributed to accretion processes and not to rotational modulation (Cody et al. 2022).
Parameters of DO Tau.
3 SPIRou observations
We observed DO Tau between 2020 February 19 and 2025 November 13, with the SPIRou nIR spectropolarimeter (Donati et al. 2020) at the CFHT, within the SPIRou Legacy Survey and the SPICE and PLANETS large programs (RUNIDs 20AP40, 20BP40, 23AP45, 23BP45, 24AP45, and 25BP45, PI J.-F. Donati). SPIRou collects unpolarized and polarized stellar spectra, covering a range of 0.95-2.50 μm at a resolving power of 70000 in a single exposure. Polarimetric observations consist of a sequence of four subexposures, with each subexposure corresponding to a different azimuth of the Fresnel rhomb retarders of the SPIRou polarimetric unit. With this procedure, we are able to remove systematics in polarized spectra to first order (Donati et al. 1997). For DO Tau, we focused on circular polarization, each recorded sequence of four subexposures yielding one unpolarized (Stokes I) and one circularly polarized (Stokes V) spectrum, as well as one null polarization check (called N) used to diagnose potential instrumental or data reduction issues. We collected 77 polarization sequences over five consecutive observing seasons covering 2094 d, 3 in early 2020, 8 in late 2020-early 2021, 3 in early 2023, 20 in early 2024, and 43 in late 2025. The total exposure times ranged from 1582 to 1627 s, while the signal-to-noise ratios (S/Ns) per 2.3 km s−1 pixel in the H band ranged from 154 to 321 (median 260).
All spectra were processed with Libre ESpRIT, the nominal reduction pipeline of ESPaDOnS at CFHT, optimized for spectropolarimetry and adapted for SPIRou (Donati et al. 2020). To all reduced spectra, we applied least-squares deconvolution (LSD; Donati et al. 1997) using a line mask computed with the VALD-3 database (Ryabchikova et al. 2015) for atmospheric parameters matching those of DO Tau (Teff = 3500 K, log g = 3.5). We only selected atomic lines deeper than 10% of the continuum level Ic (with negligible contribution from the disk) for a total of ≃1500 lines with an average wavelength and Landé factor equal to 1750 nm and 1.2. This yielded noise levels, σV, in the resulting Stokes V LSD profiles ranging from 1.6 to 4.1 (median 2.1), in units of 10−4Ic. Zeeman signatures were detected at most epochs, with typical peak-to-peak amplitudes of a few 0.1%. We computed the longitudinal field Bl (i.e., the line-of-sight component of the magnetic vector averaged over the visible stellar hemisphere, an ideal proxy for diagnosing rotational modulation; e.g., Rescigno et al. 2024) from LSD Stokes I and V profiles following Donati et al. (1997), integrating over an interval of ±30 km s−1 adequate for DO Tau. We found that Bl was well detected, and the reduced chi square assuming no field was  . The same operation applied to the null polarization spectrum N yielded
  , which is consistent with no spurious signal and indicates no issues in the observation and reduction procedures. Bℓ ranged from −193 to 276 G (median error bar 19 G, see Fig. 1 and Sect. 4) and was clearly rotationally modulated. We also computed Stokes I LSD profiles with a line mask that only included the magnetically insensitive CO bandhead lines from 2.29 to 2.40 μm deeper than 10% of Ic (−500 lines), seen in absorption and coming mostly from the star, to examine how they differed from the LSD profiles of atomic lines.
We also reduced our SPIRou data with the latest version of APERO (v0.7.294), the nominal SPIRou reduction pipeline (Cook et al. 2022) optimized for RV precision and the correction of telluric lines. We applied the line-by-line (LBL) technique (v0.65; Artigau et al. 2022) to the reduced data, yielding RVs and differential temperatures dT estimated from variations in the relative depths of veiling-corrected spectral lines with respect to their median profiles (Artigau et al. 2024). However, LBL was designed for measuring subtle changes in stellar spectra and might not be well suited for highly veiled cTTSs like DO Tau. We found that while LBL RVs show a clear rotational modulation (see Sect. 6), dT is only marginally modulated at Prot with a periodogram peaking at 12.9 d and showing several peaks of similar strength between 5 and 30 d. We also applied LSD to the APERO spectra with the masks mentioned above and derived alternative RVs, separately for atomic and CO bandhead lines, by describing each individual LSD profile as a simple first-order Taylor expansion constructed from the median of all LSD profiles (as in previous studies; e.g., Donati et al. 2024b,a). The LBL RVs were found to correlate tightly with the RVs of CO lines (Pearson’s coefficient R - 0.90) and more loosely with those of atomic lines (R - 0.80), but showed a significantly weaker modulation amplitude than either (see Sect. 6).
We used the median of the least veiled APERO-reduced spectra of DO Tau to measure the stellar parameters with ZeeTurbo (Cristofari et al. 2023) simultaneously with the small-scale magnetic field estimated from the Zeeman broadening of the spectral lines. For the stellar parameters, we found Teff = 3450 ± 50 K and log g = 3.60 ± 0.10 (assuming solar metallicity). We also deduced that DO Tau hosts a small-scale magnetic field of <B> = 2.5 ± 0.3 kG, with the 2 and 4 kG components covering 85% and 8% of the visible hemisphere on average, and the other (including the field-free component) contributing less than a few percent. This is stronger than the value derived by López-Valdivia et al. (2021, equal to 1.78 ± 0.85 kG), possibly due to long-term evolution. Given the strong veiling, individual spectra were too noisy for ZeeTurbo to yield reliable results.
The full log of our observations is provided in Table A.1. Phases and rotation cycles were derived assuming a rotation period of Prot = 5.128 d (see Table 1), counting from an arbitrary starting barycentric Julian date (BJD) of 2458 898.7 (slightly before our first observation of DO Tau).
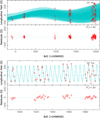 |
Fig. 1 Longitudinal magnetic field Bℓ (red dots), and QP GPR fit to the data (full cyan line) with corresponding 68% confidence intervals (dotted cyan lines). The bottom panel zooms-in on the 2025 data. The residuals, shown in the bottom plot of each panel, have an rms of 25 G ( |

MCMC GPR modeling of the Bℓ curve of DO Tau.
4 Magnetic field and temperature changes
To quantify the temporal fluctuations of Bℓ, arranged in a vector denoted y, we applied GPR (Haywood et al. 2014; Rajpaul et al. 2015) and employed the following quasi-periodic (QP) covariance function c(t, t′)
 (1)
(1)
where θ1 is the amplitude (in G) of the Gaussian process (GP), θ2 is its recurrence period (measuring Prot), θ3 is the evolution timescale on which the Bℓ curve changes shape (in d), and θ4 is a smoothing parameter controlling the amount of harmonic complexity. A fifth hyperparameter, θ5, describes the excess of uncorrelated noise on Bℓ. This ensures that the QP GPR fit can diagnose cases where the standard error bars are underestimated, and reach the solution with highest likelihood, L, defined by
 (2)
(2)
where C is the covariance matrix for all observing epochs, Σ is the diagonal variance matrix associated with y, S = θ2 J is the contribution of the additional white noise, with J the identity matrix, and n is the number of data points.
We explored the hyperparameter domain with a Markov chain Monte Carlo (MCMC) process and retrieved posterior distributions and error bars for all parameters. The MCMC and GPR modeling tools were those used in our previous studies (e.g., Donati et al. 2023). The MCMC process is a singlechain Metropolis-Hastings scheme running over a few 105 steps, including the first few 104 steps as burn-in. Convergence was checked with an autocorrelation analysis to verify that the burnin and main phase vastly exceeded the autocorrelation lengths of all parameters. We computed the marginal logarithmic likelihood, log LM, following Chib & Jeliazkov (2001).
The GPR fit we obtained is shown in Fig. 1, with a zoom-in on the 2025 data. The derived GPR hyperparameters are listed in Table 2. The rotation period we infer (5.128 ± 0.002 d) is shorter than that of prototypical mildly accreting cTTSs (e.g., AA Tau or BP Tau) and agrees better with that of lower-mass cTTSs (e.g.,V2247 Tau, Donati et al. 2010) and strong accretors (e.g., RU Lup, Armeni et al. 2024). The rotational modulation semi-amplitude of Bℓ increased steadily, growing from ≃50 G in 2020 to −200 G in 2025. Bℓ progressively evolved from being always or mostly negative in 2020 (average −94 G) and 2021 (average −28 G) to mostly positive in 2025 (average 24 G). Given the good sampling in three of our five seasons, this suggests a topological change in the large-scale field of DO Tau over our observing campaign. The poloidal field component (to which Bℓ is mostly sensitive) was slightly tilted to the stellar rotation axis in 2020 (given the low-amplitude modulation with respect to the average |Bℓ|; see Fig. 1), became more tilted in 2021 and 2024 (lower average |Bℓ| and stronger modulation), and was even more strongly tilted in 2025 following a polarity switch (maximum amplitude modulation and sign change of the average Bℓ; see Fig. 1). The achieved  (1.83) is significantly larger than 1, indicating that intrinsic variability, likely due to accretion, induced random variations in Bℓ stronger than those from photon noise.
We carried out a similar analysis on dT and confirmed that rotational modulation was marginal. The semi-amplitude of dT fluctuations was only −7 K (rms 14 K) and roughly constant with time, indicating that surface brightness features (brighter or darker than the photosphere) were either too small or the contrast was too low to induce detectable rotational modulation.
5 ZDI modeling
We applied ZDI to the LSD Stokes I and V profiles of DO Tau to model the rotational modulation of the line profiles, assuming their shapes and distortions are caused by brightness and magnetic surface features. As in previous studies, LSD profiles were corrected for veiling to remove contributions from accretion funnels, flares and the inner disk to first order. For highly veiled cTTSs, however, occultation by dense accretion funnels or strong warps in the inner accretion disk (e.g., induced by highly tilted magnetic fields, Romanova et al. 2003) might also generate profile distortions resembling those induced by brightness features; we did not include this option in the modeling to avoid making it overly complex by adding still more free parameters, but we kept it in mind when we analyzed the ZDI results. Of the five seasons for which we collected data, only two (2024 and 2025) featured a dense phase coverage to allow reliable brightness and magnetic imaging with ZDI, with a third season (2021) for which sparser sampling was achieved but on which we still applied ZDI (we kept in mind this caveat when discussing the results). Using both LSD Stokes I and V (instead of only Stokes V) profiles in the ZDI modeling ensures that the Zeeman broadening of line profiles is taken into account and that the reconstructed field is not severely underestimated (e.g., Donati et al. 2025a).
In practice, ZDI operates as outlined in previous studies. Beginning with empty magnetic maps and brightness distributions and assuming that the star rotates as a solid body, ZDI iteratively adds information on both images, exploring the parameter space with conjugate gradient techniques and comparing the synthetic Stokes profiles of the current images with observed ones at each iteration, until it reaches the requested level of agreement with the data (i.e., a given  ). The surface of DO Tau was divided into 5000 grid cells, each associated with a value of the local surface brightness (relative to the quiet photosphere). We proceeded in a different way for the magnetic field, described as a spherical harmonics (SH) expansion using the formalism of Donati et al. (2006) in its revised implementation (Lehmann & Donati 2022; Finociety & Donati 2022), where the poloidal and toroidal components of the vector field are expressed with three sets of complex SH coefficients, αℓ,m and βℓ,m for the poloidal component, and γℓ,mm for the toroidal component (I and m denoting the degree and order of the corresponding SH term in the expansion). We limited the SH expansion to ℓ = 10, consistent with the measured v sin i (see Table 2). The inversion problem is ill-posed and requires some regularization as the number of parameters is much larger than the number of independent data points. ZDI chooses the simplest solution, i.e., the solution with minimum information or maximum entropy that matches the data at the requested χ2 level, following Skilling & Bryan (1984).
Local synthetic Stokes I and V profiles for each grid cell were computed using Unno-Rachkovsky’s solution of the polarized radiative transfer equation in a plane-parallel Milne-Eddington atmosphere (Landi degl’Innocenti & Landolfi 2004), and assuming a linear center-to-limb darkening law for the continuum (with a coefficient of 0.3). At each observed rotation phase, the spectral contributions from all visible cells were summed to obtain the overall synthetic profiles, whose mean wavelength and Landé factor mirror those of our LSD profiles (1750 nm and 1.2). We assumed a Doppler width of the local profile of vD = 3.0 km s−1, typical for such stars. As in previous studies, we introduced a filling factor for the large-scale field, fv, and another for the small-scale field, fI, both assumed constant over the star. This implies that each cell with a reconstructed field B hosts a field strength B/fv in a fraction of the cell equal to fv (fI) for Stokes V (I) LSD profiles. For this study, we set fI = 0.9 (consistent with the results of ZeeTurbo; see Sect. 3) and fv = 0.2, yielding optimal fits as for similar young stars (e.g., Donati et al. 2025b). Synthetic light curves were computed in the same way by summing the contributions of all visible cells, estimated from their limb angle and reconstructed brightness at each rotation phase.
Figure 2 shows the ZDI fits to the LSD Stokes I and V profiles for each season, and Fig. 3 shows the corresponding reconstructed magnetic maps whose main characteristics are listed in Table 3. As a byproduct of the ZDI fit to the LSD Stokes profiles, we inferred that the rotational line broadening of DO Tau is equal to v sin i = 13.0 ± 0.5 km s−1 (in agreement with ZeeTurbo). The derived magnetic topology was mainly poloidal over the three seasons, with the dipole component encompassing 25-55% of the reconstructed poloidal field energy. The field was unusually complex for a young fully convective star, featuring in particular a mostly nonaxisymmetric poloidal component and a significant toroidal component. The only known cTTS with such a complex large-scale field is V2247 Oph (Donati et al. 2010). However, in contrast to DO Tau, V2247 Oph exhibited rapid temporal evolution and strong differential rotation, suggesting a different origin for its magnetic complexity. One option is that the strong accretion rate of DO Tau affects its inner convection pattern (Geroux et al. 2016) and the associated dynamo processes, leading to more complex magnetic fields. The large-scale field also evolved significantly from one season to the next, especially from 2024 to 2025, when the dipole component switched sign (as anticipated from the Bℓ variations; see Sect. 4 and Table 3), a clear difference with the large-scale fields of weakly accreting cTTSs (Zaire et al. 2024; Donati et al. 2024d,c). The small-scale field <Bs> of DO Tau inferred with ZDI (1.5 kG) remained stable throughout the campaign as did dT (see Sect. 4), a good proxy for <B> (Artigau et al. 2024; Cristofari et al. 2025). However, <Bs> is 40% smaller than <B> derived with ZeeTurbo (2.5 ± 0.3 kG) but still consistent with the estimate of López-Valdivia et al. (2021). The reconstructed field reached maximum strengths of 0.6-1.2 kG, consistent with the measurements of Dodin et al. (2013) at the funnel footpoints.
The brightness maps we simultaneously recovered with the magnetic maps all included a pair of bright and dark regions separated by about half a rotation cycle, directly reflecting the periodic distortions in the LSD Stokes I profiles causing the observed RV changes (see Fig. 2 and Sect. 6). Similar RV changes were also detected in the magnetically insensitive CO lines (see Sect. 6), demonstrating that these distortions are not caused by magnetic fields. However, the photometric curves predicted by ZDI featured a semi-amplitude (of 6-8%) larger than the observed fluctuations inferred from dT (see Fig. B.1). A tentative interpretation is that the LSD Stokes I profile distortions that ZDI interpreted as brightness spot signatures were actually caused by something else than temperature inhomogeneities, e.g., a corotating accretion funnel or a strong warp of the inner disk that regularly crossed and partially occulted the star, thereby generating no dT variations (as opposed to brightness spots).
6 RV modeling
As mentioned above, Stokes I LSD profiles of the atomic lines of DO Tau exhibited clear rotationally modulated distortions generating RV changes that ZDI interpreted as caused by brightness regions at the stellar surface. The bisector span (BIS) of the LSD profiles of atomic lines varied by about ±1 km s−1 (see Table A.1) and showed clear rotational modulation anticorrelated with RVs (R ≃ −0.68), further indicating that RV changes were mostly due to activity at the stellar surface (or to corotating occulting features in the inner disk). A similar behavior was observed in the CO lines. Modeling the RV activity jitter with QP GPR yielded semi-amplitudes θ1 of ≃0.9 km s−1 for LSD profiles of atomic and CO lines, and −0.5 km s−1 for LBL RVs, with all three GP models varying in phase with one another (as expected since the three RV sets are strongly correlated). The derived period of the RV modulation, equal to 5.129 ± 0.003 d in all three cases, is fully consistent with that derived from Bℓ (see Sect. 4).
To investigate whether DO Tau might host a massive planet in its close circumstellar environment, we also modeled RVs by adding a sine wave to describe the RV effect of a putative massive planet on a circular orbit in addition to the QP GP term describing activity. We studied the periodograms of the residuals of the activity-only GPR fit for the three sets of RVs and found that the LBL RVs exhibited the largest peaks at a period of 21.1 d and its most prominent one-month alias (66.5 d) with false-alarm probabilities (FAPs) of −0.1% (each peak surrounded by one-year aliases). The 21.1 d peak also dominated the residual periodogram of the RVs of the CO lines (but at a weaker level, with an FAP of a few percent and a one-month alias at 68.2 d), accompanied by another peak at 7.5 d. This is consistent with LBL RVs being dominated by information from molecular lines (including CO lines) in M stars. In contrast, the residual periodogram of RVs of the atomic lines instead showed a main peak at 15.6 d (again with an FAP of a few percent) plus a number of weaker peaks (including one at 21.1 d). That the RVs of atomic lines did not yield the same results as the other two RV sets suggests that these periodogram peaks might not be related to close-in planets (expected to affect all RV sets in an identical way) but rather to density structures in the inner accretion disk. We nonetheless explored the possibility that the main period in LBL RVs (at 21.1 d), also detected in RVs of CO lines, probes a candidate planet, to estimate its minimum mass in case it is real.
We achieved this by comparing the result of an MCMC fit to the LBL RVs with a model featuring a candidate planet and a QP GP describing activity, with that of a similar MCMC fit assuming no planet, the difference in log LM yielding the logarithmic Bayes factor in favor of the candidate planet. We found that the optimal orbital period was Pb = 21.14 ± 0.02 d corresponding to an orbital distance of 0.12 ± 0.01 au, with a semi-amplitude of Kp = 0.22 ± 0.04 km s−1 indicating a minimum planet mass of 2.0 ± 0.4 M♃ (planet mass of 2.8 ± 0.6 M♃ assuming i = 45°). The detected signal is apparently significant, with a logarithmic Bayes factor of ∆ log LM = 13.3. Assuming that the candidate planet is on a Keplerian orbit yielded only a marginal improvement in log LM over the case with a circular orbit. The full result of the MCMC fit is outlined in Table 4 and the corresponding fit to the LBL RVs is shown in Fig. 4 (with a zoom-in on the 2025 data in Fig. C.1). The corresponding periodograms of the raw, filtered and residual LBL RVs are shown in the left panel of Fig. 5 where the peak at Pb features an FAP level of 0.006%. The
stacked periodogram of the filtered RVs, displayed in the right panel of the same figure, exhibits a peak at Pb that strengthened irregularly as the number of points increased. This fluctuating peak strength might come from stochastic variability induced by accretion; alternatively, it might reflect that the detected RV signal comes from activity associated with a variable disk structure and not from a candidate planet. The corresponding phase-folded filtered and residual RV curves are shown in Fig. 6.
Finally, we ran injection recovery tests to investigate the semi-amplitude threshold above which detections can be considered as reliable, for orbital periods of 6 to 100 d (see Fig. C.2). We found that, for periods in the range 8-25 d, Kb ≃ 0.23 km s−1 (corresponding to minimal masses of the candidate planet of 1.5 to 2.2 M♃) is required on average to ensure a reliable detection with ∆ log LM = 10. Beyond the drop in sensitivity for periods close to the synodic period of the Moon, the planet detectability weakens slightly, with Kb ≃ 0.25 kms−1 being required for a secure detection at an orbital period of 100 d (corresponding to a minimum mass 3.8 M♃ ). This confirms that the candidate planet we identified is close to the detection threshold of our dataset.
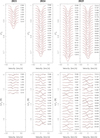 |
Fig. 2 Observed (thick black line) and modeled (thin red line) LSD Stokes I (top row) and V (bottom row) profiles of DO Tau in 2021, 2024, and 2025 (from left to right). Rotation cycles (counting from 60, 279, and 388 in 2021, 2024, and 2025, respectively, see Table A.1) are indicated to the right of the LSD profiles, and ±1σ error bars are shown to the left of the Stokes V profiles. |
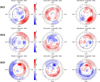 |
Fig. 3 Reconstructed maps of the large-scale field of DO Tau showing the radial, azimuthal and meridional components in spherical coordinates (left, middle and right columns, units in G), for seasons 2021, 2024, and 2025 (top to bottom rows, respectively). These maps, derived from the LSD Stokes I and V profiles of Fig. 2 using ZDI, are displayed in a flattened polar projection down to latitude −45°, with the north pole at the center and the equator depicted as a bold line. Outer ticks mark the phases of observations. Positive radial, azimuthal, and meridional fields point outward, counterclockwise, and poleward, respectively. |
Large-scale and small-scale fields measured from the magnetic topologies derived with ZDI in 2021, 2024, and 2025.
7 Accretion and activity
The spectrum of DO Tau is subject to strong veiling, indicating high accretion rates at the surface of the star. We measured this veiling by comparing the equivalent widths (EW) of the LSD Stokes I profiles of DO Tau with those of the weak-line T Tauri stars TWA 25 and V819 Tau, whose spectral types are similar (as in Sousa et al. 2023). We obtained a first estimate, rJH, from atomic lines (concentrating mostly in the JH band), and a second one, rK, from the CO bandhead lines (redward of 2.28 μm). The values we obtained, listed in Table A.1, range from 1.0 to 3.6 for rJH (median 1.5), and from 1.6 to 6.1 for rK (median 2.7). We found that rK correlated well with rJH (R ≃ 0.86), with rK being twice as large as rJH on average. However, neither rJH nor rK showed rotational modulation, each exhibiting various peaks in the periodogram (including one at −21 d).
We also examined the 1083 nm He I triplet and constructed the 2D periodograms of its profile for seasons 2024 and 2025 (see Fig. 7). The line profile featured redshifted emission associated with accretion processes (extending to 250 km s−1) as well as blueshifted absorption and emission probing the stellar and disk winds (extending to −250 kms−1). It also featured redshifted absorption (between 50 and 200 km s−1) tracing accretion funnels or strong warps in the inner accretion disk regularly crossing the line of sight. Rotational modulation was detected in the central emission peak, possibly related to chromospheric emission (as in PDS 70, Donati et al. 2024a); in 2025, rotational modulation was also observed in the redshifted absorption. In the blueshifted component probing the stellar and disk winds, longer periods, ranging from 13 d (in 2024 and 2025) to −16 d (in 2025 only), were also observed at low velocities, suggesting transient phenomena occurring at the base of the wind every few stellar rotation cycles. In 2025, i.e., the season for which our dataset was most extended, the 2D periodogram rapidly evolved with time, with the blueshifted component showing a period of ≃17 d in the first half of the dataset, then clear rotational modulation in the second half (see Fig. D.2). Rapid evolution was likely also at work in previous epochs.
We similarly investigated the 1282 nm Pa β and 2166 nm Brγ lines, whose profiles and 2D periodograms for seasons 2024 and 2025 are shown in Figs. 8 and D.1. Both lines exhibited similar patterns, Brγ being weaker and more noisy than Pa β. The blueshifted half of both lines showed periods similar to those seen in the blue wing of He I, suggesting that it is also associated with winds from the star and the disk; the redshifted absorption of Pa β and Brγ, probing funnel or inner disk material crossing the line of sight, showed conspicuous rotational modulation from velocities 50 to 200 kms−1 in 2024, but only up to 150 kms−1 and occurring at lower velocities in Brγ than in Pa β in 2025. As for He I, the 2D periodograms of both lines evolved with time in 2025, showing both 11 and 16 d periods in the blueshifted half of the profile in the first half of the season, then no periodicity in the second half. Similarly, rotational modulation of the redshifted absorption, obvious in the first half of the season, vanished almost completely in the second half (see Figs. D.3 and D.4). This suggests that unstable accretion occurred at the stellar surface from the inner accretion disk.
By summing the 50-200 km s−1 spectral bins of each line, we obtained fluxes that are rotationally modulated, more clearly for Brγ than for Pa β but nonetheless well correlated with one another (R - 0.75). Though noisier than Paß, Brγ was less subject to accretion-related stochastic variations, and exhibited cleaner rotational modulation of the redshifted absorption. A GPR fit to these fluxes (with θ3 and θ4 fixed to 600 and 0.7 as in Table 4) yielded period estimates of 5.10 ± 0.05 d for both lines, consistent with our determination of Prot within the error bars. Maximum redshifted absorption in Paß and Brγ, signaling the phase at which the absorbing material crossed the line of sight, occurred at phases 0.80-0.90 in 2021, 0.15-0.25 in 2024, and 0.40-0.50 in 2025. In 2024, this phase roughly coincided with the phase toward which the reconstructed dipole component was tilted (0.16; see Table 3) and with the bright region reconstructed with ZDI (see Fig. B.1), implying that the redshifted absorption was likely caused by the main accretion funnel crossing the line of sight. The bright photospheric region might have reflected the hot chromospheric spot, although dT did not show a maximum at this phase (see Fig. B.1). In 2021, in contrast, the phase of maximum Pa β and Brγ redshifted absorption occurred about half a rotation cycle later than the phase toward which the inferred dipole component was tilted (0.31; see Table 3), as if the accretion funnel crossing the line of sight was now connected to the positive (rather than negative) pole of the dipole. It also coincided with the dark (rather than the bright) region reconstructed with ZDI (see Fig. B.1). In 2025, finally, maximum Pa β and Brγ redshifted absorption occurred roughly at mid distance between the crossing of the negative and positive poles (located close to the equator at phases 0.18 and 0.68, respectively; see Fig. 3), and matched the dark spot reconstructed with ZDI (see Fig. B.1), suggesting this time that it might probe a strong warp of the inner disk.
We computed the emission EWs for Pa β and Brγ (see Table A.1) and found that they correlated with veiling rJH and rK (R ≃ 0.7 and 0.6 for Paβ and Brγ, respectively). We also found that Paβ and Brγ EWs were strongly correlated with one another (R ≃ 0.95), with Paβ EWs being stronger than Brγ ones by an average factor of 4.2 (2.7 after correcting for veiling). We then used the scaling relations of Fiorellino et al. (2025) and our stellar parameters (see Table 1) to turn the veiling-corrected EWs of Paβ and Brγ into accretion fluxes and logarithmic mass-accretion rates log Ṁ for each visit. We derived time-averaged values of −7.72 ± 0.24 dex (Ṁ in M⊙ yr−1) for Paβ and −7.78 ± 0.31 dex for Brγ, the error bar denoting the dispersion over all visits. Taking the weighted average of both estimates yielded log Ṁ = −7.74 ± 0.19 dex, consistent with previous results (Alcalá et al. 2021; Sousa et al. 2023; Perraut et al. 2026). We found for individual seasons that DO Tau accreted mass marginally faster in 2021 (log Ṁ = −7.47 ± 0.15 dex) and in 2024 (−7.65 ± 0.14 dex) than in 2025 (−7.87 ± 0.16 dex), without a clear variation between the first and second half of the 2025 season. From the average mass-accretion rate, the intensity of the reconstructed dipole component of the large-scale field (0.200.30 kG; see Table 3) and the stellar parameters of Table 1, we derive following Bessolaz et al. (2008), that the magnetospheric gap of DO Tau extended to a distance of rmag = 1.6 ± 0.3 R* or 0.014 ± 0.002 au (the error bar corresponding to variations in the dipole field strength and the mass accretion rate), implying that rmag/rcor = 0.30 ± 0.05 where rcor denotes the corotation radius (located at 5.4 R*, i.e., 0.047 au) at which the Keplerian angular velocity equals the rotation rate at the stellar surface. Our rmag estimate is consistent with that inferred with Gravity from the size of the Brγ emitting region (Perraut et al. 2026).
In this regime and following Blinova et al. (2016), magnetospheric accretion is expected to be unstable but ordered, with one to two tongues of accreted material penetrating the magnetosphere in the equatorial plane. For an inclined dipole, accretion at the surface of the star is expected to be rotationally modulated and to fluctuate with the Keplerian period of the inner disk (0.84 d), generating rapid intrinsic variability in addition to rotational modulation1. This is qualitatively consistent with what we observed, with maximum redshifted absorption occurring in conjunction with either poles of the magnetic dipole in 2021 and 2024. For dipoles that are strongly tilted to the rotation axis (as in 2025), magnetospheric accretion is predicted to proceed directly to the magnetic poles in the equatorial plane and to generate a strong warp in the inner disk at mid distance from magnetic poles (Romanova et al. 2003). We speculate that this strong warp generated the periodic distortions in Stokes I profiles and redshifted absorption in emission lines in 2025. The disk warp material, located well within the corotation radius and forced to corotate with the star, was unable to escape falling toward the star, albeit at reduced speed given the transverse orientation of the magnetic field. This makes our observations qualitatively consistent with theoretical expectations. Given the low rmag, we also expect the higher SH terms of the magnetic topology to contribute to rendering the accretion pattern more complex and unstable. The large-scale field of DO Tau is too weak to prevent accretion of angular momentum from the disk, causing the star to speed up, in contrast to more slowly rotating cTTSs with stronger fields and lower accretion rates (like CI Tau, Donati et al. 2024d).
We also studied the [Fe II] J and H and H2 lines (at 1257.02, 1644.00, and 2121.83 nm), which probe the jet and outflow of DO Tau (Erkal et al. 2021) and were found to vary very weakly. We report a ≃1 km s−1 shift of the [Fe II] lines from 2024 to 2025.
MCMC results of the modeling of LBL RVs.
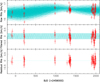 |
Fig. 4 Raw (top), filtered (middle), and residual (bottom) LBL RVs of DO Tau (red dots) over the observing period. The top panel shows the MCMC fit to the data, including a QP GPR modeling of the activity and a candidate planet on a 21.14 d circular orbit (cyan). The middle panel shows the planet RV signature (cyan) after activity was filtered out. The rms of the residuals is 0.21 km s−1. A zoom-in on the 2025 data is shown in Fig. C.1. |
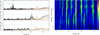 |
Fig. 5 Standard and stacked Lomb-Scargle periodograms of the RV data. Left panel: periodogram of the raw (top), filtered (middle), and residual (bottom) LBL RV data, including a candidate planet on a 21.14 d circular orbit in the MCMC modeling. The dashed vertical cyan lines trace the stellar rotation period and the candidate planet orbital period, and the dashed horizontal lines indicate a 0.1% FAP level in the periodogram of the RV data. The orange curve depicts the periodogram of the window function. Right panel: stacked periodograms of the filtered LBL RVs, as a function of the number of RV points included in the Fourier analysis. The color-scale indicates the logarithmic power in the periodogram. The vertical dashed line traces the candidate planet orbital period. |
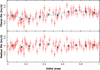 |
Fig. 6 Phase-folded filtered (top) and residual (bottom) LBL RVs for the model with a candidate planet on a 21.14 d circular orbit. The red dots show the measured RVs, and the black stars indicate average RVs over ten even phase bins. |
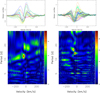 |
Fig. 7 Stacked Stokes I profiles (top plots) and 2D periodograms (bottom plots) of the 1083.3 nm He I IRT in the stellar rest frame for seasons 2024 (left panels) and 2025 (right panels). The dashed horizontal line traces Prot and the vertical dotted lines depict the velocities of the three components of the He I triplet. The color-scale traces the logarithmic power in the periodogram. Only the main peaks (yellow to red and extending over several velocity bins) are likely to be significant. |
8 Summary
We carried out a spectropolarimetric study of DO Tau based on 77 SPIRou Stokes I and V spectra collected from early 2020 to late 2025. From the detected Zeeman polarization signatures in LSD profiles of atomic lines, we infer that DO Tau rotates in Prot = 5.128 ± 0.002 d, with its rotation axis inclined at 45 ± 8° to the line of sight, slightly more than the inclination of the outer accretion disk. The rotational broadening of spectral lines, v sin i = 13.0 ± 0.5 km s−1, implied that DO Tau has a radius of R* = 1.9 ± 0.2 R⊙. The atmospheric parameters derived with ZeeTurbo, Teff = 3450 ± 50 K and log g = 3.6 ± 0.1, suggest that DO Tau is still fully convective, with an age of 1.7 ± 0.5 Myr.
We found that the average large-scale and small-scale magnetic field strengths at the surface of DO Tau were equal to 0.35 and 2.5 kG, respectively. The large-scale field reconstructed with ZDI was mostly nonaxisymmetric and featured a significant toroidal component. The dipole component of the poloidal field, ranging from 0.2 to 0.3 kG, became more inclined with respect to the rotation axis, with the negative pole eventually changing hemisphere between the last two seasons. If this is confirmed, DO Tau is the first cTTS for which a global polarity switch of the large-scale magnetic field is detected, bringing further evidence that large-scale magnetic fields of cTTSs are dynamo amplified rather than fossil fields. The large-scale field of DO Tau was unusually weak and complex for a cTTS (see Fig. 9). DO Tau even differs from its closest cTTS neighbor in our Hertzsprung-Russel diagram, V2247 Oph, whose complex field varied very rapidly under strong differential rotation (Donati et al. 2010). This difference might be caused by intense accretion from the inner disk that affects convection and dynamo action (Geroux et al. 2016).
Strong and variable veiling and fluxes in emission lines were detected at all times and were well correlated, but showed no rotational modulation, emphasizing the stochastic nature of accretion from the inner disk. The average logarithmic massaccretion rate derived from veiling-corrected Paβ and Brγ fluxes was equal to log Ṁ = −7.74 ± 0.19 dex, marginally stronger in 2021 and 2024 than in 2025. The magnetospheric radius we derived from the large-scale dipole, the mass accretion rate and the stellar parameters is equal to 1.6 ± 0.3 R* or 0.30 ± 0.05rcor, suggesting that accretion is complex and unstable on DO Tau, occurring via a few tongues penetrating the magnetosphere in the equatorial plane. The redshifted absorption in Paβ and Brγ, most of the time modulated by rotation, was interpreted as due to accretion funnels linking the inner disk to one of the magnetic poles and regularly crossing the line of sight. In 2025, however, this redshifted absorption was instead attributable to a warp in the inner accretion disk likely induced by the strongly tilted magnetosphere. Stellar and disk wind signatures were also detected in the blue wings of the He I triplet, Paβ and Brγ, with periods varying between 13 and 16 d from one season to the next, presumably reflecting sporadic events induced by accretion bursts; rotational modulation of the He I wind signatures was also observed in the second half of the 2025 season.
The RVs of DO Tau, either measured with LBL on all lines or on LSD profiles of atomic and CO lines, also varied, reflecting mainly rotational modulation caused by activity. We report a potential RV contribution from a candidate massive planet orbiting within the inner disk at a distance of 0.12 ± 0.01 au (orbital period Pb = 21.14 ± 0.02 d). The detected RV signature, best seen in LBL RVs and in CO lines but only marginally in atomic lines, featured a semi-amplitude of Kb = 0.22 ± 0.04 kms−1, would imply a minimum mass of 2.0 ± 0.4 M♃ for the candidate planet, i.e., a mass of 2.8 ± 0.6 M♃ if the orbital motion takes place in the stellar equatorial plane. The observed RV signal is close to the detection threshold of our dataset according to planet injection recovery tests, however. Moreover, the three RV sets yielded differing periodograms, and the veiling also showed some power at 21 d, which might suggest that the reported RV signature comes from activity related to a density structure in the inner disk and not from a close-in planet.
Our spectropolarimetric and velocimetric study of DO Tau showed that collecting both types of data is essential for characterizing the physical processes taking place in the close environments of young cTTSs, especially those featuring strong accretion rates. For instance, work like this can test the tentative scenarios invoked to explain the wiggle of the jet axis (Erkal et al. 2021), i.e., a warp induced by a magnetic disk wind or a slightly inclined close-in massive planet. If this is confirmed, the candidate planet is less massive than required (6-12 M♃), but in the correct range of orbital distances (0.10-0.15 au) and on a possibly inclined orbit given the misalignment of the inner and outer disks. In addition, the variable stellar magnetic field switching polarity might be an alternative option for generating warps in the inner disk. Follow-up monitoring of DO Tau simultaneously with SPIRou and ESPaDOnS at optical and nIR wavelengths (i.e., with VISION, to be commissioned at the CFHT in 2026) and complementary instruments should reveal which of these options explains the observations best. It will also further document the temporal evolution of the large-scale magnetic field of DO Tau and its possible cyclic variations, clarify the effect of strong accretion on the dynamo processes and the dynamics of convective zones in young low-mass stars, and ultimately improve physical realism in models of star and planet formation.
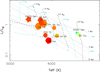 |
Fig. 9 Basic properties of the large-scale magnetic topologies of cTTSs, as a function of their locations in the Hertzsprung-Russel diagram. The symbol size indicates relative magnetic intensities, the symbol colour illustrates the field configurations (red to blue for purely poloidal to purely toroidal fields), and the symbol shape depicts the degree of axisymmetry of the poloidal field component (decagon and stars for purely axisymmetric and purely nonaxisymmetric poloidal fields, respectively). We also show the most recent magnetic (black) and nonmagnetic (cyan) PMS evolutionary tracks (dashed lines) and isochrones (dotted lines) of Feiden (2016). |
Data availability
SPIRou data used in this study are, or will soon be, publicly available at the Canadian Astronomy Data Center (https://www.cadc-ccda.hia-iha.nrc-cnrc.gc.ca).
Acknowledgements
We thank an anonymous referee for constructive comments that improved the paper. This work benefited from the SIMBAD CDS database at URL http://simbad.u-strasbg.fr/simbad and the ADS system at URL https://ui.adsabs.harvard.edu. We thank Dr Greg Feiden for providing us the tracks and isochrones of his latest magnetic and non-magnetic stellar evolution models. Our study is based on data obtained at the CFHT, operated by the CNRC (Canada), INSU/CNRS (France) and the University of Hawaii. The authors wish to recognise and acknowledge the very significant cultural role and reverence that the summit of Maunakea has always had within the indigenous Hawaiian community. SHPA acknowledges financial support from CNPq, CAPES and Fapemig. FM received funding from the European Research Council (ERC) under the European Union’s Horizon Europe research and innovation program (grant agreement #101053020 Dust2Planets).
References
- Alcalá, J. M., Manara, C. F., Natta, A., et al. 2017, A&A, 600, A20 [NASA ADS] [CrossRef] [EDP Sciences] [Google Scholar]
- Alcalá, J. M., Gangi, M., Biazzo, K., et al. 2021, A&A, 652, A72 [NASA ADS] [CrossRef] [EDP Sciences] [Google Scholar]
- Amard, L., & Matt, S. P. 2023, A&A, 678, A7 [NASA ADS] [CrossRef] [EDP Sciences] [Google Scholar]
- Armeni, A., Stelzer, B., Frasca, A., et al. 2024, A&A, 690, A225 [NASA ADS] [CrossRef] [EDP Sciences] [Google Scholar]
- Artigau, É., Cadieux, C., Cook, N. J., et al. 2022, AJ, 164, 84 [NASA ADS] [CrossRef] [Google Scholar]
- Artigau, É., Cadieux, C., Cook, N. J., et al. 2024, AJ, 168, 252 [Google Scholar]
- Baraffe, I., Homeier, D., Allard, F., & Chabrier, G. 2015, A&A, 577, A42 [NASA ADS] [CrossRef] [EDP Sciences] [Google Scholar]
- Barber, M. G., Mann, A. W., Vanderburg, A., et al. 2024, Nature, 635, 574 [NASA ADS] [CrossRef] [Google Scholar]
- Bessolaz, N., Zanni, C., Ferreira, J., Keppens, R., & Bouvier, J. 2008, A&A, 478, 155 [NASA ADS] [CrossRef] [EDP Sciences] [Google Scholar]
- Blinova, A. A., Romanova, M. M., & Lovelace, R. V. E. 2016, MNRAS, 459, 2354 [Google Scholar]
- Braun, T. A. M., Yen, H.-W., Koch, P. M., et al. 2021, ApJ, 908, 46 [NASA ADS] [CrossRef] [Google Scholar]
- Chib, S., & Jeliazkov, I. 2001, J. Am. Statist. Assoc., 96, 270 [Google Scholar]
- Cody, A. M., Hillenbrand, L. A., & Rebull, L. M. 2022, AJ, 163, 212 [NASA ADS] [CrossRef] [Google Scholar]
- Cook, N. J., Artigau, É., Doyon, R., et al. 2022, PASP, 134, 114509 [NASA ADS] [CrossRef] [Google Scholar]
- Cristofari, P. I., Donati, J. F., Folsom, C. P., et al. 2023, MNRAS, 522, 1342 [NASA ADS] [CrossRef] [Google Scholar]
- Cristofari, P. I., Donati, J.-F., Bellotti, S., et al. 2025, A&A, 702, A111 [NASA ADS] [CrossRef] [EDP Sciences] [Google Scholar]
- Dodin, A. V., Lamzin, S. A., & Chuntonov, G. A. 2013, Astrophys. Bull., 68, 177 [Google Scholar]
- Donati, J.-F., Semel, M., Carter, B. D., Rees, D. E., & Collier Cameron, A. 1997, MNRAS, 291, 658 [NASA ADS] [CrossRef] [Google Scholar]
- Donati, J.-F., Howarth, I. D., Jardine, M. M., et al. 2006, MNRAS, 370, 629 [NASA ADS] [CrossRef] [Google Scholar]
- Donati, J., Skelly, M. B., Bouvier, J., et al. 2010, MNRAS, 402, 1426 [NASA ADS] [CrossRef] [Google Scholar]
- Donati, J. F., Kouach, D., Moutou, C., et al. 2020, MNRAS, 498, 5684 [Google Scholar]
- Donati, J. F., Cristofari, P. I., Finociety, B., et al. 2023, MNRAS, 525, 455 [NASA ADS] [CrossRef] [Google Scholar]
- Donati, J. F., Cristofari, P. I., Alencar, S. H. P., et al. 2024a, MNRAS, 535, 3363 [Google Scholar]
- Donati, J. F., Cristofari, P. I., Carmona, A., & Grankin, K. 2024b, MNRAS, 534, 231 [Google Scholar]
- Donati, J. F., Cristofari, P. I., Lehmann, L. T., et al. 2024c, MNRAS, 531, 3256 [Google Scholar]
- Donati, J. F., Finociety, B., Cristofari, P. I., et al. 2024d, MNRAS, 530, 264 [NASA ADS] [CrossRef] [Google Scholar]
- Donati, J. F., Cristofari, P. I., Klein, B., Finociety, B., & Moutou, C. 2025a, A&A, 700, A122 [NASA ADS] [CrossRef] [EDP Sciences] [Google Scholar]
- Donati, J. F., Gaidos, E., Moutou, C., et al. 2025b, A&A, 698, L14 [NASA ADS] [CrossRef] [EDP Sciences] [Google Scholar]
- Erkal, J., Dougados, C., Coffey, D., et al. 2021, A&A, 650, A46 [NASA ADS] [CrossRef] [EDP Sciences] [Google Scholar]
- Feiden, G. A. 2016, A&A, 593, A99 [NASA ADS] [CrossRef] [EDP Sciences] [Google Scholar]
- Fernández-López, M., Zapata, L. A., Rodríguez, L. F., et al. 2020, AJ, 159, 171 [Google Scholar]
- Finociety, B., & Donati, J. F. 2022, MNRAS, 516, 5887 [NASA ADS] [CrossRef] [Google Scholar]
- Fiorellino, E., Alcalá, J. M., Manara, C. F., et al. 2025, A&A, 704, A42 [NASA ADS] [CrossRef] [EDP Sciences] [Google Scholar]
- Fischer, W. J., Hillenbrand, L. A., Herczeg, G. J., et al. 2023, in Astronomical Society of the Pacific Conference Series, 534, Protostars and Planets VII, eds. S. Inutsuka, Y. Aikawa, T. Muto, K. Tomida, & M. Tamura, 355 [Google Scholar]
- Gaia Collaboration. 2020, VizieR Online Data Catalog: Gaia EDR3, VizieR Online Data Catalog: I/350. Originally published in: 2021A&A...649A...1G [Google Scholar]
- Geroux, C., Baraffe, I., Viallet, M., et al. 2016, A&A, 588, A85 [NASA ADS] [CrossRef] [EDP Sciences] [Google Scholar]
- Haywood, R. D., Collier Cameron, A., Queloz, D., et al. 2014, MNRAS, 443, 2517 [Google Scholar]
- Huang, J., Ginski, C., Benisty, M., et al. 2022, ApJ, 930, 171 [NASA ADS] [CrossRef] [Google Scholar]
- Krolikowski, D. M., Kraus, A. L., & Rizzuto, A. C. 2021, AJ, 162, 110 [NASA ADS] [CrossRef] [Google Scholar]
- Landi degl’Innocenti, E., & Landolfi, M. 2004, Polarisation in spectral lines (Dordrecht/Boston/London: Kluwer Academic Publishers) [Google Scholar]
- Lehmann, L. T., & Donati, J. F. 2022, MNRAS, 514, 2333 [CrossRef] [Google Scholar]
- Long, F., Herczeg, G. J., Harsono, D., et al. 2019, ApJ, 882, 49 [Google Scholar]
- López-Valdivia, R., Sokal, K. R., Mace, G. N., et al. 2021, ApJ, 921, 53 [CrossRef] [Google Scholar]
- Pérez Paolino, F., Bary, J. S., Hillenbrand, L. A., Markham, M., & Fischer, W. J. 2025, ApJ, 978, 32 [Google Scholar]
- GRAVITY Coll. Perraut et al. 2026, A&A, in press, https://doi.org/10.1851/8084-6361/202558438 [Google Scholar]
- Rajpaul, V., Aigrain, S., Osborne, M. A., Reece, S., & Roberts, S. 2015, MNRAS, 452, 2269 [Google Scholar]
- Rescigno, F., Mortier, A., Dumusque, X., et al. 2024, MNRAS, 532, 2741 [Google Scholar]
- Romanova, M. M., Ustyugova, G. V., Koldoba, A. V., Wick, J. V., & Lovelace, R. V. E. 2003, ApJ, 595, 1009 [Google Scholar]
- Romanova, M. M., Koldoba, A. V., Ustyugova, G. V., et al. 2021, MNRAS, 506, 372 [NASA ADS] [CrossRef] [Google Scholar]
- Romanova, M. M., Espaillat, C. C., Wendeborn, J., et al. 2025, MNRAS, 538, 480 [Google Scholar]
- Romanova, M. M., Koldoba, A. V., Ustyugova, G. V., Espaillat, C. C., & Lovelace, R. V. E. 2026, MNRAS, 547, stag103 [Google Scholar]
- Ryabchikova, T., Piskunov, N., Kurucz, R. L., et al. 2015, Phys. Scr, 90, 054005 [Google Scholar]
- Skilling, J., & Bryan, R. K. 1984, MNRAS, 211, 111 [NASA ADS] [CrossRef] [Google Scholar]
- Sousa, A. P., Bouvier, J., Alencar, S. H. P., et al. 2023, A&A, 670, A142 [NASA ADS] [CrossRef] [EDP Sciences] [Google Scholar]
- Winter, A. J., Booth, R. A., & Clarke, C. J. 2018, MNRAS, 479, 5522 [Google Scholar]
- Zaire, B., Donati, J.-F., Alencar, S. P., et al. 2024, MNRAS, 533, 2893 [Google Scholar]
Periodograms of the TESS light curves also show peaks at periods shorter than Prot down to about −1 d, in line with model predictions.
Appendix A SPIRou observations: additional material
Table A.1 provides the observation log for the SPIRou spectra of DO Tau, and the measurements derived from them at each epoch.
Observing log of our SPIRou observations of DO Tau
Appendix B ZDI modeling: Additional material
Figure B.1 shows, for each season, the brightness maps derived simultaneously with the magnetic maps of Fig. 3 and the corresponding photometric light curves compared to those derived from dT.
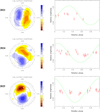 |
Fig. B.1 Maps of the logarithmic relative surface brightness (with respect to the quiet photosphere, left panels) reconstructed simultaneously with the magnetic maps of Fig. 3 with ZDI from the LSD Stokes I and V profiles of Fig. 2, and corresponding photometric light curves (right panels, green curves) along with estimates inferred from dT measurements (assuming a blackbody at photospheric temperature, red circles). In the brightness maps, yellow and blue depict regions darker and brighter than the quiet photosphere, respectively. |
Appendix C RV modeling: Additional material
Figure C.1 shows the RV curve and MCMC + GPR fit, zooming-in on the 2025 data. Figure C.2 shows the detectability of RV signatures as a function of orbital period for our DO Tau RV data.
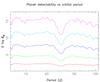 |
Fig. C.2 Logarithmic Bayes factor ∆ log LM as a function of orbital period for planet RV signatures of semi-amplitudes 0.10 (red), 0.15 (green), 0.20 (blue), 0.25 (cyan), and 0.30 km s−1 (purple), once averaged over all phases. Note the drop in ∆ log LM at orbital periods close to the synodic period of the Moon. |
Appendix D Accretion and activity: Additional material
Figure D.1 shows the 2D periodogram of the Brγ line in season 2024 and 2025. Figures D.2, D.3, and D.4 show similar plots for the first and second half of the 2025 season, for the He I, Paβ, and Brγ lines.
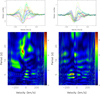 |
Fig. D.2 Same as Fig. 7 for the first (left panel) and second (right panel) half of the 2025 season data set. |
All Tables
Large-scale and small-scale fields measured from the magnetic topologies derived with ZDI in 2021, 2024, and 2025.
All Figures
|
Fig. 1 Longitudinal magnetic field Bℓ (red dots), and QP GPR fit to the data (full cyan line) with corresponding 68% confidence intervals (dotted cyan lines). The bottom panel zooms-in on the 2025 data. The residuals, shown in the bottom plot of each panel, have an rms of 25 G ( |
| In the text | |
|
Fig. 2 Observed (thick black line) and modeled (thin red line) LSD Stokes I (top row) and V (bottom row) profiles of DO Tau in 2021, 2024, and 2025 (from left to right). Rotation cycles (counting from 60, 279, and 388 in 2021, 2024, and 2025, respectively, see Table A.1) are indicated to the right of the LSD profiles, and ±1σ error bars are shown to the left of the Stokes V profiles. |
| In the text | |
|
Fig. 3 Reconstructed maps of the large-scale field of DO Tau showing the radial, azimuthal and meridional components in spherical coordinates (left, middle and right columns, units in G), for seasons 2021, 2024, and 2025 (top to bottom rows, respectively). These maps, derived from the LSD Stokes I and V profiles of Fig. 2 using ZDI, are displayed in a flattened polar projection down to latitude −45°, with the north pole at the center and the equator depicted as a bold line. Outer ticks mark the phases of observations. Positive radial, azimuthal, and meridional fields point outward, counterclockwise, and poleward, respectively. |
| In the text | |
|
Fig. 4 Raw (top), filtered (middle), and residual (bottom) LBL RVs of DO Tau (red dots) over the observing period. The top panel shows the MCMC fit to the data, including a QP GPR modeling of the activity and a candidate planet on a 21.14 d circular orbit (cyan). The middle panel shows the planet RV signature (cyan) after activity was filtered out. The rms of the residuals is 0.21 km s−1. A zoom-in on the 2025 data is shown in Fig. C.1. |
| In the text | |
|
Fig. 5 Standard and stacked Lomb-Scargle periodograms of the RV data. Left panel: periodogram of the raw (top), filtered (middle), and residual (bottom) LBL RV data, including a candidate planet on a 21.14 d circular orbit in the MCMC modeling. The dashed vertical cyan lines trace the stellar rotation period and the candidate planet orbital period, and the dashed horizontal lines indicate a 0.1% FAP level in the periodogram of the RV data. The orange curve depicts the periodogram of the window function. Right panel: stacked periodograms of the filtered LBL RVs, as a function of the number of RV points included in the Fourier analysis. The color-scale indicates the logarithmic power in the periodogram. The vertical dashed line traces the candidate planet orbital period. |
| In the text | |
|
Fig. 6 Phase-folded filtered (top) and residual (bottom) LBL RVs for the model with a candidate planet on a 21.14 d circular orbit. The red dots show the measured RVs, and the black stars indicate average RVs over ten even phase bins. |
| In the text | |
|
Fig. 7 Stacked Stokes I profiles (top plots) and 2D periodograms (bottom plots) of the 1083.3 nm He I IRT in the stellar rest frame for seasons 2024 (left panels) and 2025 (right panels). The dashed horizontal line traces Prot and the vertical dotted lines depict the velocities of the three components of the He I triplet. The color-scale traces the logarithmic power in the periodogram. Only the main peaks (yellow to red and extending over several velocity bins) are likely to be significant. |
| In the text | |
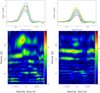 |
Fig. 8 Same as Fig. 7 for the 1282 nm Pa β line (left: 2024, right: 2025). |
| In the text | |
|
Fig. 9 Basic properties of the large-scale magnetic topologies of cTTSs, as a function of their locations in the Hertzsprung-Russel diagram. The symbol size indicates relative magnetic intensities, the symbol colour illustrates the field configurations (red to blue for purely poloidal to purely toroidal fields), and the symbol shape depicts the degree of axisymmetry of the poloidal field component (decagon and stars for purely axisymmetric and purely nonaxisymmetric poloidal fields, respectively). We also show the most recent magnetic (black) and nonmagnetic (cyan) PMS evolutionary tracks (dashed lines) and isochrones (dotted lines) of Feiden (2016). |
| In the text | |
|
Fig. B.1 Maps of the logarithmic relative surface brightness (with respect to the quiet photosphere, left panels) reconstructed simultaneously with the magnetic maps of Fig. 3 with ZDI from the LSD Stokes I and V profiles of Fig. 2, and corresponding photometric light curves (right panels, green curves) along with estimates inferred from dT measurements (assuming a blackbody at photospheric temperature, red circles). In the brightness maps, yellow and blue depict regions darker and brighter than the quiet photosphere, respectively. |
| In the text | |
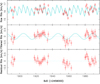 |
Fig. C.1 Same as Fig. 4, zooming-in on the 2025 data |
| In the text | |
|
Fig. C.2 Logarithmic Bayes factor ∆ log LM as a function of orbital period for planet RV signatures of semi-amplitudes 0.10 (red), 0.15 (green), 0.20 (blue), 0.25 (cyan), and 0.30 km s−1 (purple), once averaged over all phases. Note the drop in ∆ log LM at orbital periods close to the synodic period of the Moon. |
| In the text | |
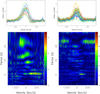 |
Fig. D.1 Same as Fig. 7 for the 2268 nm Brγ line (left: 2024, right: 2025). |
| In the text | |
|
Fig. D.2 Same as Fig. 7 for the first (left panel) and second (right panel) half of the 2025 season data set. |
| In the text | |
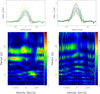 |
Fig. D.3 Same as Fig. D.2 for the 1282 nm Paβ line (left: first half of 2025, right: second half). |
| In the text | |
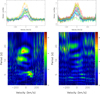 |
Fig. D.4 Same as Fig. D.2 for the 2268 nm Brγ line (left: first half of 2025, right: second half). |
| In the text | |
Current usage metrics show cumulative count of Article Views (full-text article views including HTML views, PDF and ePub downloads, according to the available data) and Abstracts Views on Vision4Press platform.
Data correspond to usage on the plateform after 2015. The current usage metrics is available 48-96 hours after online publication and is updated daily on week days.
Initial download of the metrics may take a while.