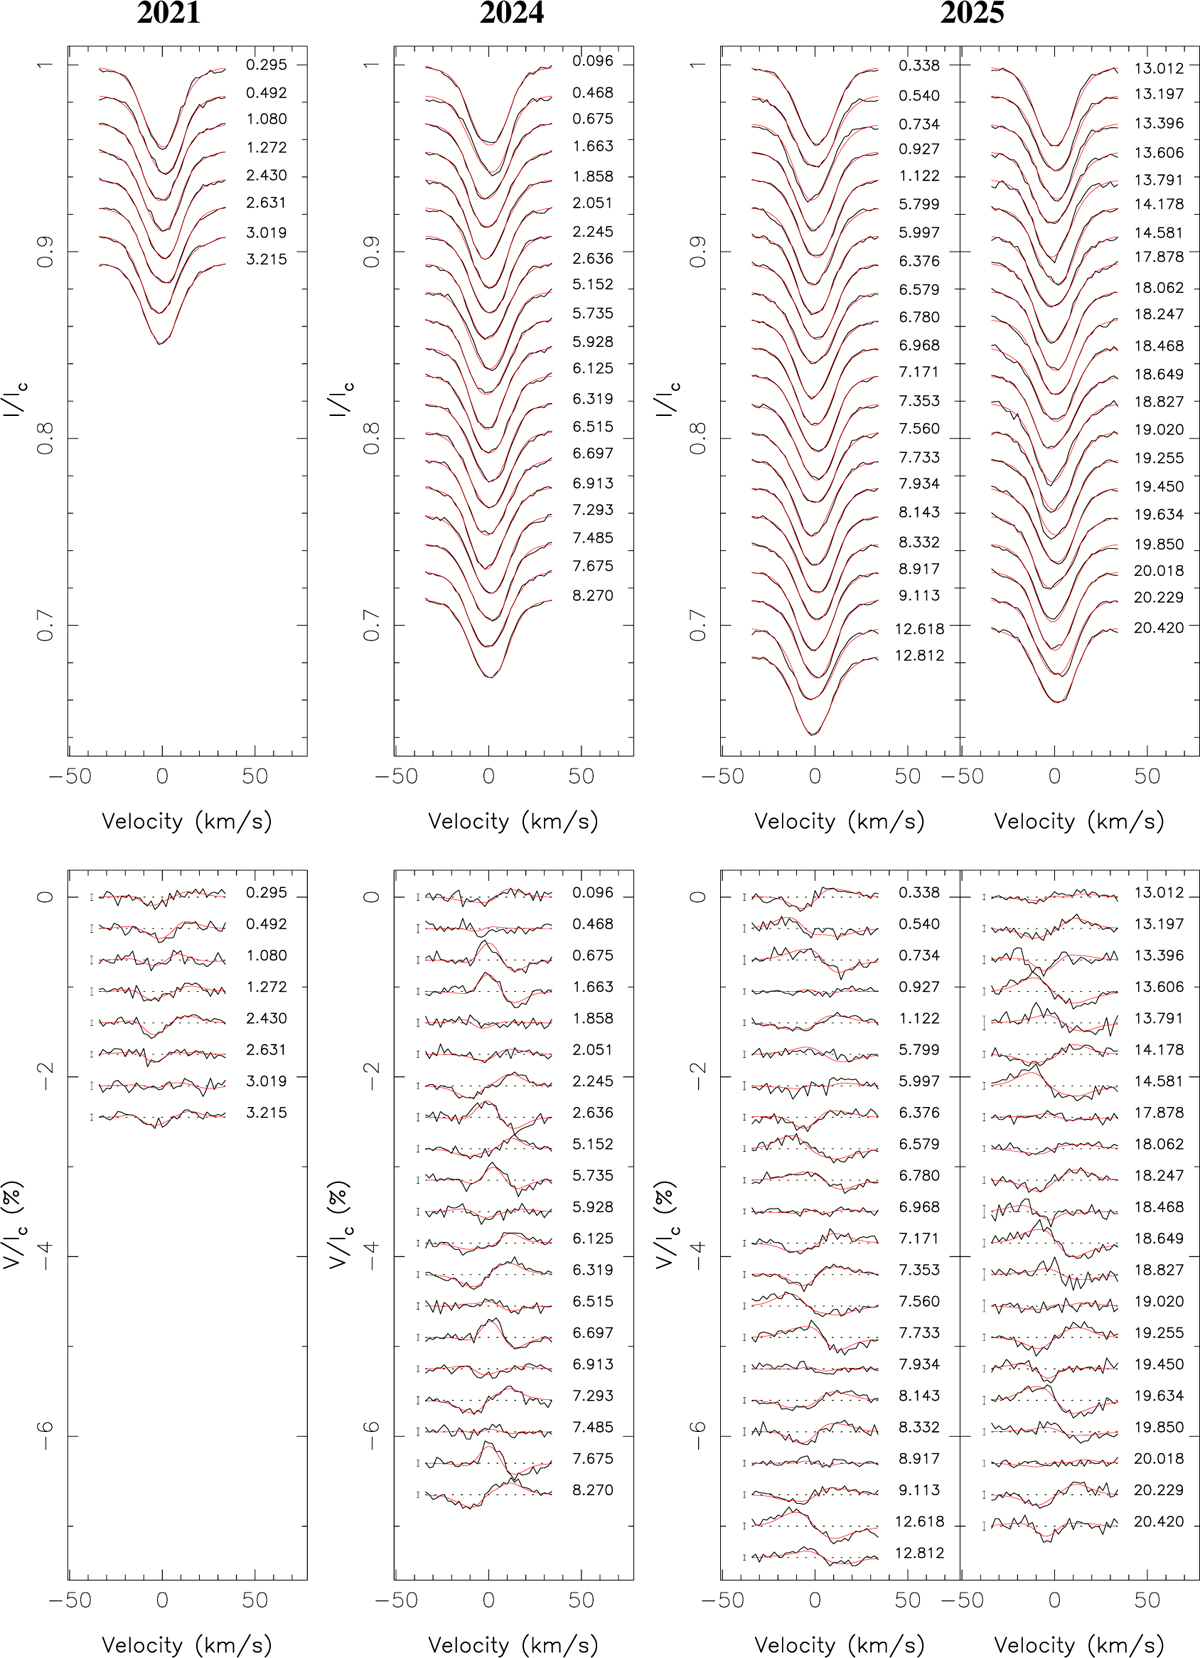
Fig. 2
Download original image
Observed (thick black line) and modeled (thin red line) LSD Stokes I (top row) and V (bottom row) profiles of DO Tau in 2021, 2024, and 2025 (from left to right). Rotation cycles (counting from 60, 279, and 388 in 2021, 2024, and 2025, respectively, see Table A.1) are indicated to the right of the LSD profiles, and ±1σ error bars are shown to the left of the Stokes V profiles.
Current usage metrics show cumulative count of Article Views (full-text article views including HTML views, PDF and ePub downloads, according to the available data) and Abstracts Views on Vision4Press platform.
Data correspond to usage on the plateform after 2015. The current usage metrics is available 48-96 hours after online publication and is updated daily on week days.
Initial download of the metrics may take a while.