Fig. 5
Download original image
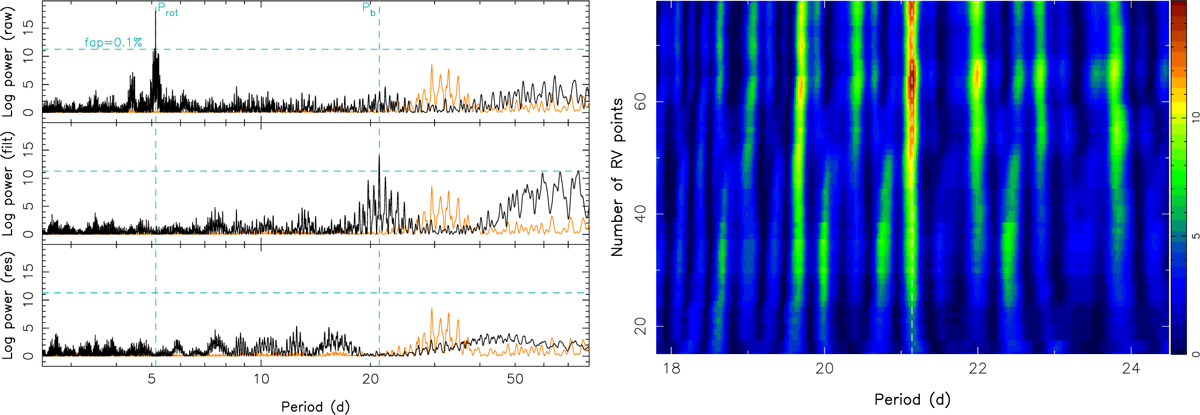
Standard and stacked Lomb-Scargle periodograms of the RV data. Left panel: periodogram of the raw (top), filtered (middle), and residual (bottom) LBL RV data, including a candidate planet on a 21.14 d circular orbit in the MCMC modeling. The dashed vertical cyan lines trace the stellar rotation period and the candidate planet orbital period, and the dashed horizontal lines indicate a 0.1% FAP level in the periodogram of the RV data. The orange curve depicts the periodogram of the window function. Right panel: stacked periodograms of the filtered LBL RVs, as a function of the number of RV points included in the Fourier analysis. The color-scale indicates the logarithmic power in the periodogram. The vertical dashed line traces the candidate planet orbital period.
Current usage metrics show cumulative count of Article Views (full-text article views including HTML views, PDF and ePub downloads, according to the available data) and Abstracts Views on Vision4Press platform.
Data correspond to usage on the plateform after 2015. The current usage metrics is available 48-96 hours after online publication and is updated daily on week days.
Initial download of the metrics may take a while.