Fig. 7
Download original image
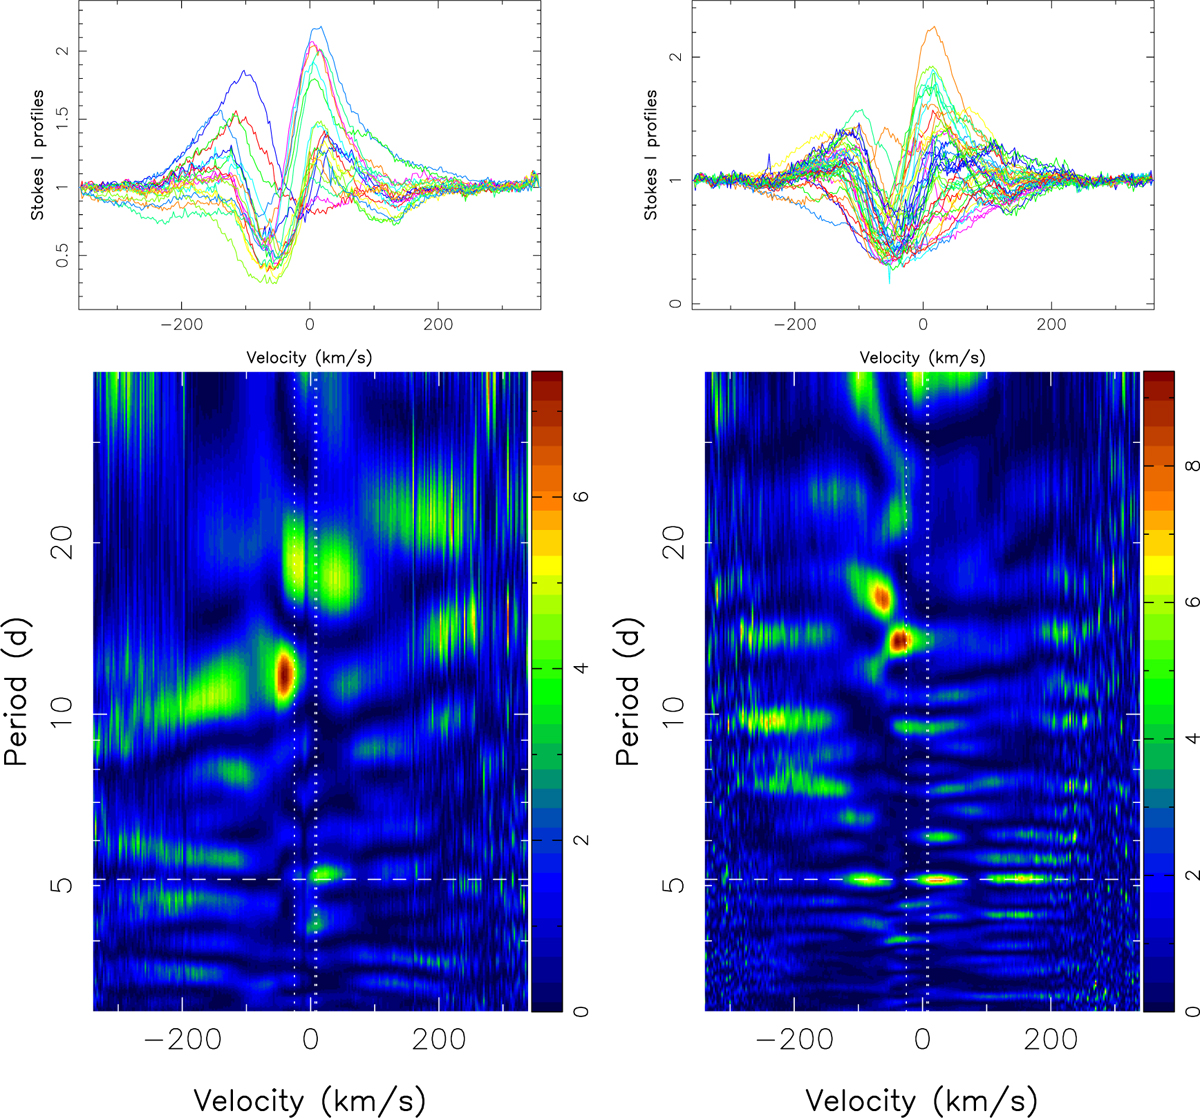
Stacked Stokes I profiles (top plots) and 2D periodograms (bottom plots) of the 1083.3 nm He I IRT in the stellar rest frame for seasons 2024 (left panels) and 2025 (right panels). The dashed horizontal line traces Prot and the vertical dotted lines depict the velocities of the three components of the He I triplet. The color-scale traces the logarithmic power in the periodogram. Only the main peaks (yellow to red and extending over several velocity bins) are likely to be significant.
Current usage metrics show cumulative count of Article Views (full-text article views including HTML views, PDF and ePub downloads, according to the available data) and Abstracts Views on Vision4Press platform.
Data correspond to usage on the plateform after 2015. The current usage metrics is available 48-96 hours after online publication and is updated daily on week days.
Initial download of the metrics may take a while.