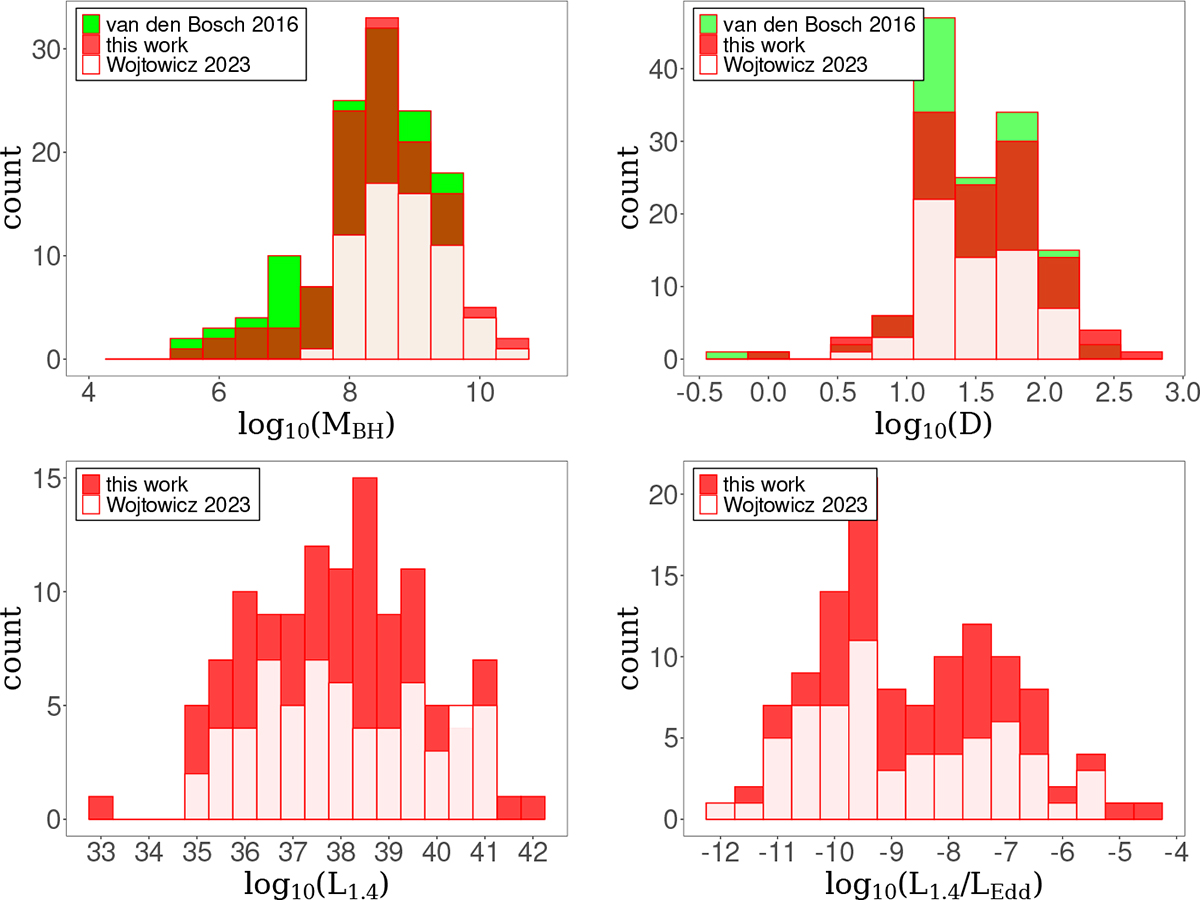
Fig. 1.
Download original image
Histogram showing the distribution of log10 MBH for sources presented in this work in red, Wójtowicz et al. (2023) in white, and early-type sources from van den Bosch (2016) in green in the top-right. Distribution of source distances (in Mpc), plotted on a logarithmic scale using the same color scheme in the top-left. The bottom-right and bottom-left histograms show the distributions of log10 L1.4 and L1.4 GHz/LEdd for sources from Wójtowicz et al. (2023) in white and this work in red, respectively.
Current usage metrics show cumulative count of Article Views (full-text article views including HTML views, PDF and ePub downloads, according to the available data) and Abstracts Views on Vision4Press platform.
Data correspond to usage on the plateform after 2015. The current usage metrics is available 48-96 hours after online publication and is updated daily on week days.
Initial download of the metrics may take a while.