| Issue |
A&A
Volume 708, April 2026
|
|
|---|---|---|
| Article Number | A2 | |
| Number of page(s) | 15 | |
| Section | Extragalactic astronomy | |
| DOI | https://doi.org/10.1051/0004-6361/202558695 | |
| Published online | 25 March 2026 | |
Driver behind the bimodal distribution of Eddington-scaled radio luminosity in nearby early-type galaxies
1
Department of Theoretical Physics and Astrophysics, Faculty of Science, Masaryk University, Kotláršká 2, Brno 61137, Czechia
2
Astronomical Observatory, Jagiellonian University, ul. Orla 171, PL-30244 Kraków, Poland
3
Space Science Division, Naval Research Laboratory, Washington, DC 20375, USA
★ Corresponding author: This email address is being protected from spambots. You need JavaScript enabled to view it.
Received:
19
December
2025
Accepted:
4
February
2026
Abstract
Context. Early-type galaxies host low-luminosity active galactic nuclei, as indicated by radio emission spanning up to several orders of magnitude in terms of the physical scale, ranging from compact parsec-scale to extended kiloparsec-scale radio morphology.
Aims. We investigate the Eddington-scaled radio luminosity distribution of nearby early-type galaxies in a large sample of 117 sources to confirm whether this distribution is bimodal, as previously inferred for a smaller sample of 62 galaxies. We also consider whether the bimodality can be attributed to specific host galaxy properties.
Methods. We compiled a sample of early-type galaxies with black hole masses measured using direct methods, as well as the radio flux densities at 1.4 GHz and 3 GHz. We used statistical tests to confirm whether the Eddington-scaled radio luminosities are bimodal. We investigated the properties of radio-dim and -bright sources, assessed the presence of extended jets with VLASS imaging, and examined host galaxy kinematics and central stellar structure.
Results. We confirm, using a twice larger sample of all known 1.4 GHz-detected early-type galaxies with directly measured black hole masses (117 galaxies), that the distribution of L1.4 GHz/LEdd is bimodal, with a characteristic antimode at L1.4 GHz/LEdd ≈ −8.6, which disappears when considering the subset of sources with black hole masses obtained using the MBH − σ★ relation. The radio-bright peak is dominated by galaxies hosting resolved jets, while radio-dim systems show compact nuclear emission with many showing excess radio emission relative to that expected from star formation as indicated by the well-known far-infrared and radio (FIR-radio) correlation. Moreover, we find that radio-bright galaxies are primarily slow rotators with depleted stellar cores, whereas radio-dim galaxies are predominantly fast rotators.
Conclusions. We show that nearby early-type galaxies with direct black hole mass measurements exhibit a clear bimodality in Eddington-scaled radio luminosity, separating radio-dim nuclei with compact emission from radio-bright systems hosting extended jets. The dichotomy correlates strongly with host-galaxy kinematics and central structure, suggesting that the ability to sustain jet production is governed primarily by galaxy assembly history and feeding mode, rather than by black hole mass or accretion rate alone. In this term, the radio output of radio-dim sources likely reflects modest, intermittent supplies of magnetized gas delivered to the accretion flow through stochastic processes and, most plausibly, the tidal disruption of giant-branch stars passing through the immediate vicinity of the supermassive black hole (SMBH).
Key words: catalogs / galaxies: active / galaxies: elliptical and lenticular / cD / galaxies: jets / galaxies: star formation
© The Authors 2026
 Open Access article, published by EDP Sciences, under the terms of the Creative Commons Attribution License (https://creativecommons.org/licenses/by/4.0), which permits unrestricted use, distribution, and reproduction in any medium, provided the original work is properly cited.
This article is published in open access under the Subscribe to Open model. This email address is being protected from spambots. You need JavaScript enabled to view it. to support open access publication.
1. Introduction
Elliptical galaxies can be classified into two main groups based on their observed properties. One group consists of massive ellipticals, typically with stellar masses exceeding ∼1011 M⊙. These galaxies often possess halos of hot, X-ray–emitting gas and are frequently associated with strong radio sources (Bender et al. 1989). Their luminosity profiles commonly exhibit core flattening and boxy isophotes (Faber et al. 1997). Kinematic studies show that massive ellipticals usually rotate slowly and often contain kinetically decoupled components, while displaying a notable amount of rotation along the galaxy minor axis (Cappellari et al. 2007; Emsellem et al. 2007). On the other hand, less massive ellipticals rarely exhibit detectable X-ray halos and typically show weak or no radio emission. Their luminosity profiles generally follow a smooth, power law-like distribution and their isophotes tend to be more disk-like. Kinematically, these less massive galaxies often show significant rotation along the galaxy’s major axis.
Elliptical galaxies are typical hosts of quasars, namely, active galactic nuclei (AGNs) accreting near the Eddington limit (e.g., Dunlop et al. 2003; McLure et al. 1999; Floyd et al. 2004). While all quasars, owing to the universality of accretion-disk emission, exhibit similar optical properties, their radio properties can vary substantially, with some quasars detected in the radio band, while others are not. A fundamental dichotomy in the underlying radio-emission mechanisms of quasars was first tentatively suggested in early studies by Kellermann et al. (1989), who proposed two distinct classes: radio-quiet and radio-loud quasars, based on the bimodal distribution of the ratio of radio-to-optical-flux densities.
Complementing this dichotomy among quasar sources and extending it to the broader population of elliptical galaxies exhibiting varying levels of nuclear activity, large-sky radio surveys show that radio-emitting galaxies fall into two broad morphological classes at the resolution typical of such surveys: (a) resolved systems with extended jets and (b) unresolved, compact radio sources.
The origin of radio emission in extended radio galaxies is relatively well established: their powerful outflows are thought to be launched via the Blandford–Znajek mechanism, where the rotational energy is extracted from a spinning black hole threaded by magnetic fields anchored in the surrounding accreting matter (Blandford & Znajek 1977). In this model, the outflow power is set by the mass supply (accretion rate), which regulates the magnetic flux threading the black hole horizon, and by the black hole spin. However, the physical mechanisms responsible for collimating and accelerating these outflows to their terminal bulk velocities remain a matter of debate.
The characteristics of radio emissions from compact radio galaxies continue to be somewhat enigmatic and shrouded in mystery. Radio emission, in principle, is mostly associated with synchrotron processes, where relativistic particles are accelerated in a turbulent magnetic field, preferentially at the fronts of strong shock waves. However, such conditions occur not only in AGN-driven winds or jets but also in star-forming regions, particularly in the central parts of galaxies, implying that both environments may contribute to the observed radio emission. A comprehensive summary of the problem associated with radio emission in various types of AGNs was presented in a number of studies, including reviews by Blandford et al. (2019) and Tadhunter (2016).
Observations of X-ray binaries support the importance of spin in launching the jet (Narayan & McClintock 2012); however, on the other hand, many active galaxies with measured high spin values are radio-quiet (see Reynolds 2021, for a recent review). Thus, it seems that high spin alone is not sufficient to launch powerful and collimated outflows, highlighting the importance of accretion rate and magnetic field accumulation. In most recent studies, particularly those based on numerical simulations (see Komissarov & Porth 2021, for a review), jets have indeed been found to form most efficiently in the “magnetically arrested disk” (MAD) regime. In this state, the poloidal magnetic flux accumulated near the black hole reaches saturation, enabling the efficient extraction of rotational energy from the ergosphere and creating a rigid, magnetically dominated funnel around the jet base that facilitates its initial collimation.
A comprehensive review of the radio emission mechanisms in radio-quiet AGNs is given in Panessa et al. (2019). Here, in this context and building on our previous analysis presented in Wójtowicz et al. (2023), we investigate the origin of the radio emission in a sample of early-type galaxies with accurately measured supermassive black-hole (SMBH) masses. These systems accrete at low or extremely low rates and are typically observed to be radio-faint.
In Wójtowicz et al. (2023), we used a sample of 62 early-type galaxies with directly estimated BH masses, MBH, to identify a possible bimodality in a distribution of the logarithm of the integrated 1.4 GHz radio luminosities. It is expressed as a fraction of their Eddington luminosities, log L1.4 GHz/LEdd, where  .
.
In this paper, we present a large sample of 123 early-type galaxies with significant radio detections at 1.4 GHz. Six sources were subsequently excluded because they only have upper limits to their BH mass estimates, thus giving a net sample of 117 galaxies for our analysis. We use this sample to test whether the bimodality identified in Wójtowicz et al. (2023) remains valid in the expanded sample.
2. Sample selection and data acquisition
An extensive search of the current literature allowed us to compile a list of all galaxies with central SMBH masses measured using direct methods, including measurements based on direct observations of gas and stellar kinematics, as well as from reverberation mapping. Here, we only focus and present the sample of early-type galaxies (i.e., lenticular or elliptical). These were classified through visual investigation of the available optical images in Digital Sky Survey (DSS)1, Sloan Digital Sky Survey (SDSS)2, and Panoramic Survey Telescope & Rapid Response System (Pan-STARRS)3. In cases of unclear morphology, we further investigated any available high-resolution images through Hubble Legacy Archive4. A galaxy was classified as early-type if its luminosity distribution decreased smoothly from the center and showed no signs of spiral arms or disturbance, such as tidal tails. Objects whose optical luminosity was dominated by the central QSO component were excluded, since the QSO light prevents reliable morphological classification.
The sample analyzed in Wójtowicz et al. (2023) only included sources that were previously examined in an X-ray studied sample by Gaspari et al. (2019), with the additional requirement of a 1.4 GHz detection and early-type morphology. In the present work, we relax this criterion by including all early-type galaxies listed in van den Bosch (2016) with reported 1.4 GHz fluxes. In their paper, van den Bosch (2016) compiled black hole mass measurements for a heterogenous sample of 294 galaxies, of which 141 have an early-type morphology. Among these, 34 either lack reported 1.4 GHz fluxes or have fluxes below the detection limit of the instrument. We included 16 additional sources that were not part of these earlier samples, for which more recent black hole mass estimates are available. We updated the masses of two further sources, namely, PG 0026+129 and NGC 7619.
Figure 1 shows the distributions of black hole mass (MBH), distance (D), radio luminosity (L1.4 GHz), and Eddington-scaled radio luminosity (L1.4 GHz/LEdd). The top-right panel illustrates the selection effects on the MBH distribution. In Wójtowicz et al. (2023), the requirement of an hot X-ray halo detection biased the sample towards higher black hole masses (white histogram) and smaller distances, compared to the underlying population of early-type galaxies from the van den Bosch (2016) parent catalog (green histogram) and the sample presented in this work (red histogram). However, the lower panels show that the ranges of L1.4 GHz and L1.4 GHz/LEdd covered by the samples are similar.
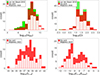 |
Fig. 1. Histogram showing the distribution of log10 MBH for sources presented in this work in red, Wójtowicz et al. (2023) in white, and early-type sources from van den Bosch (2016) in green in the top-right. Distribution of source distances (in Mpc), plotted on a logarithmic scale using the same color scheme in the top-left. The bottom-right and bottom-left histograms show the distributions of log10 L1.4 and L1.4 GHz/LEdd for sources from Wójtowicz et al. (2023) in white and this work in red, respectively. |
The full sample consists of 123 early-type galaxies. Six galaxies have only upper-limit estimates for their black hole masses (namely UGC 1214, NGC 2685, NGC 3945, NGC 4382, UGC 9799, and NGC 4150) and these have been excluded from the analysis presented in the subsequent sections of this paper. Most of these 123 sources were observed and detected with the NRAO Very Large Array (VLA) at 1.4 GHz with a 45 arcsec resolution, and cataloged in Condon et al. (1998). The corresponding integrated 1.4 GHz flux densities are also listed in the NASA/IPAC Extragalactic Database (NED)5.
Flux densities for the faintest sources not included in the Condon et al. (1998) cataloged were taken from the Brown et al. (2011) study of a near-infrared-bright (NIR-bright; 2MASS K < 9 mag) sample of early-type galaxies, where the estimates were derived from stacked NVSS images. Three additional sources (NGC 1023, NGC 4429, and NGC 4459) that were undetected in Brown et al. (2011) were later successfully detected in 1.4 GHz VLA observations of early type galaxies from the ATLAS3D survey by Nyland et al. (2017).
For the brightest extended sources (S1.4 GHz > 0.6 Jy), Brown et al. (2011) supplemented the 1.4 GHz VLA measurements from Condon et al. (1998) with low-resolution (≈12′) single-dish imaging from the 300-ft Green Bank and the 64-m Parkes radio telescopes in order to recover the total extended emission more accurately. Several of the brightest galaxies in our sample (NGC 7626, NGC 0741, A 1836 BCG, NGC 3862, NGC 5128) were later also re-examined by Allison et al. (2014) using archival 1.4 GHz NVSS data (Condon et al. 1998). They reported higher and more accurate flux densities than those listed in Brown et al. (2011) and we adopted the Allison et al. (2014) values for these objects. For two additional bright sources not included in the aforementioned catalogs, Cygnus A and 3C 390.3, we used the fluxes reported in Bîrzan et al. (2004) and White & Becker (1992), respectively. The integrated 1.4 GHz radio luminosities of the studied galaxies span almost ten orders of magnitude, from ∼1032 to ∼1042 erg s−1. Among these sources, 16 were detected at only a marginal significance (i.e., S/N < 3).
To complement these measurements, we also utilized 3 GHz VLASS data, which provide 2.5 arcsec resolution. The 8 arcsec cutout maps were obtained using the CIRADA server6. Radio maps were successfully retrieved for 121 of the 123 objects in our sample. Two sources, NGC 5128 (located at Dec < −43°) and Cygnus A (which saturates the VLASS images), are not covered by the survey. Among the VLASS detections, 24 sources show no significant emission at the expected position, 48 exhibit only an unresolved radio core coincident with the host galaxy, and 10 show tentative evidence for small-scale extended structures. Table A.1 in Appendix A presents our full sample together with the measured radio fluxes and the corresponding references.
3. Radio emission of early-type galaxies
3.1. Integrated 1.4 GHz radio flux
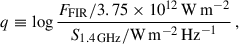
In Figure 2, we show the histogram of log L1.4 GHz/LEdd for all 117 sources with precise BH masses. The left panel presents the distribution based on BH masses estimated via one of the direct methods, while the right panel presents the corresponding distribution obtained indirectly from stellar velocity dispersion, using the scaling relation of Graham & Scott (2013). Notably, the bimodal structure evident in the direct-method distribution disappears when the BH masses are estimated using the scaling relation.
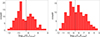 |
Fig. 2. Left: histogram of integrated 1.4 GHz radio luminosity expressed in Eddington units, estimated using BH masses determined via direct methods. The position of the antimode at log L1.4 GHz/LEdd = −8.6, identified using the locmodes function, is indicated by a black vertical line. Right: Same as the left panel, but using BH masses estimated indirectly from the MBH − σ* relation of Graham & Scott (2013). The vertical line indicates the position of the antimode at log L1.4 GHz/LEdd = −8.6. |
To robustly identify the true number of modes in our integrated log L1.4 GHz/LEdd distribution, we fit the Gaussian mixture models with number of components ranging from one to five. This method is implemented in the GaussianMixtures function in sBIC package in R-Studio Statistical Software. Based on this analysis and according to the singular Bayesian information criterion (sBIC) (Drton & Plummer 2017), we found that the two-mode Gaussian mixture model provides the best description of our data. Next, to further test the bimodal hypothesis, we used a maximum likelihood method implemented in the mle2 function of bbmle package in R, to fit a mixture of two Gaussians f(x) = p × f1 + (1 − p)×f2, where f1 and f2 denote normal distributions, and p is the mixture weight. The parameters of the mixture distribution f(x) obtained through the maximum likelihood method are shown in Table 1.
Fitted components of Gaussian mixture model.
We applied the criterion of Schilling et al. (2002) stating that the mixture density, f(x) = p × f1 + (1 − p)×f2, is bimodal only if |μ2 − μ1| exceeds (σ1 + σ2) times the value indicated where the “value indicated” depends on the standard deviation ratio and the weight (see Table 2 therein). In our case, σ1/σ2 ≈ 0.78 and p ≈ 0.5, implying according to Schilling et al. (2002) that our mixture density is bimodal if and only if |μ2 − μ1|> 1.25 × (σ1 + σ2). This condition is satisfied for the values of the model parameters obtained using the maximum likelihood method as provided in Table 1. This supports the presence of the two modes in the analyzed dataset.
We find the position of the antimode in the log L1.4 GHz/LEdd distribution using the R-Studio Statistical Software and locmodes function, implemented in the package multimode from the CRAN repository. We set the true number of modes, mod0 = 2, as supported by the analysis presented above. The position of the antimode was found at log L1.4 GHz/LEdd = −8.6 dividing our sample into two categories: “radio-dim” objects with log L1.4 GHz/LEdd ≤ −8.6 and “radio-bright” if log L1.4 GHz/LEdd > −8.6. Here, we note that 34 early-type sources from van den Bosch (2016), which either lack reported 1.4 GHz flux measurements or have fluxes below the instrumental detection limit (0.5 mJy), are not included in this paper. These sources would be classified as radio-dim, with log(L1.4 GHz/LEdd)≪ − 8.6.
3.2. VLASS radio core emission at 3 GHz
We investigated whether the distribution of 3 GHz core luminosity expressed as the fraction of Eddington luminosity, log L3 GHz/LEdd, is also bimodal. Thus, we utilized the 3 GHz VLASS radio maps to measure the fluxes associated with core emission; namely, we measured the fluxes from beam size area centered at the position of host galaxy coordinates. The fluxes were measured through the Analysis task in DS9 software following the Gaussian beam–area formula,
 (1)
(1)
where F is the flux spectral density measured in Jy, S is the sum of pixel values provided in Jy/beam units, and PS is the pixel size in arscec2, while θmaj and θmin are the beam FWHM axes measured in arsecs. The obtained core flux densities are given in Table A.1.
To investigate the true number of modes in the log L3 GHz/LEdd distribution within our dataset, we performed an analogous analysis as that performed for the 1.4 GHz integrated radio luminosity. However, a fit of the Gaussian mixture models to the distribution of log(L3 GHz/LEdd), with the number of components ranging from one to five, strongly prefers a unimodal Gaussian distribution; thus, we found no evidence to support a bimodal distribution in core-related log(L3 GHz/LEdd).
4. IR diagnostics
4.1. WISE colours
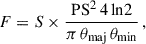
WISE magnitudes for the analyzed sources were obtained by cross-matching the sample coordinates with the WISE All-Sky Survey catalog, adopting a matching radius of 12″. In Figure 3, we show the radio-faint and radio-bright sources separately on the WISE color-color diagnostic diagram. The corresponding photometric information is summarized in Table B.1, presented in Appendix B.
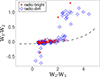 |
Fig. 3. WISE color-color diagram for the analyzed early-type galaxies. Sources belonging to the radio-dim and radio-bright classes are denoted as open blue diamonds and filled red circles respectively. The dashed line indicates the star formation sequence, as in Equation (2). |
It is clear that the sample is not homogeneous in terms of nuclear activity. In particular, about 15 radio-bright galaxies show mid-IR (MIR) emission dominated by the AGN component, most likely associated with hot circumnuclear dust reprocessing the UV/X-ray radiation from accretion onto the SMBH (see, e.g., Jarrett et al. 2011; Stern et al. 2012; Mateos et al. 2012). Two radio-faint galaxies, NGC 1194 and NGC 5252, also stand out as notable outliers, with NGC 1194 exhibiting the most extreme W1 − W2 color in the sample. The remaining sources closely follow the tight “star formation sequence” introduced by Jarrett et al. (2019), which can be approximated by the functional form,
 (2)
(2)
indicated in Figure 3 by the dashed curve. Thus, basically all radio-faint sources, as well as the majority of the radio-bright ones, appear to be ISM-dominated in the IR regime. Consequently, the far-infrared (FIR) diagnostics discussed below for assessing the origin of the radio emission are robust, in the sense that they reliably identify the “radio-excess” systems.
We note that in this context that several of our radio-dim galaxies are characterized by W1 − W2 < 0, indicating that their NIR emission is dominated by stellar photospheres on the Rayleigh–Jeans tail, with essentially no detectable contribution from warm dust. Such colors place these systems below the star-formation sequence of Jarrett et al. (2019) and are characteristic of passive, dust-poor hosts with negligible star formation and no radiatively efficient AGN. In this regime, star formation cannot account for the observed radio emission and the lack of a MIR AGN signature likewise excludes the presence of a persistent accretion disk.
4.2. FIR-radio correlation
We compiled 60 μm and 100 μm FIR fluxes for all sources in our target list, except for 21 sources which lack any FIR measurements. This was achieved by matching the coordinates of our sources with IRAS Point Source catalog v.2, Serendipitous Survey catalog and Faint Sources catalog, adopting the matching radius 30 arcsec. If a source was detected in more than one catalog, we adopted the fluxes from our preferred catalog, following the priority order: Point Source Catalog, Faint Source Catalog, and, finally, Serendipitous Survey Catalog. For sources that are not identified in these catalogs, we explored NASA/IPAC Extragalactic Database7 to check the availability of the fluxes at 60 μm and 100 μm measured in archival IRAS observations. The final list of the IR fluxes is given in Tables C.1 and C.2 in Appendix C.
The FIR–radio correlation is well established at all redshifts, with star-forming galaxies expected to lie within a narrow range of values of the q parameter defined by Helou et al. (1985) as
 (3)
(3)
where ![Mathematical equation: $ F_{\mathrm{FIR}}/{\mathrm{W}\,\mathrm{m}^{-2}} = 1.26 \times 10^{-14} \, [2.58 \times S_{60\,{\upmu}\mathrm{m}}/\mathrm{Jy} + S_{100\,{\upmu}\mathrm{m}}/\mathrm{Jy}] $](/articles/aa/full_html/2026/04/aa58695-25/aa58695-25-eq6.gif) . In Figure 4, we plot the distribution of this FIR-radio colour in our sample as a function of the BH mass. As before, radio-bright sources with log L1.4 GHz/LEdd > −8.6 are denoted in the figure with red color and radio-dim sources with log L1.4 GHz/LEdd < −8.6 are marked with blue. The shaded areas in the plot denote the range corresponding to the median q = 2.40 with ±2σq dispersion, where σq = 0.24, as established by Ivison et al. (2010) for the galaxies in the GOODS-North field, based on the Herschel and VLA observations (also see in this context Magnelli et al. 2015; Delhaize et al. 2017; Giulietti et al. 2022).
. In Figure 4, we plot the distribution of this FIR-radio colour in our sample as a function of the BH mass. As before, radio-bright sources with log L1.4 GHz/LEdd > −8.6 are denoted in the figure with red color and radio-dim sources with log L1.4 GHz/LEdd < −8.6 are marked with blue. The shaded areas in the plot denote the range corresponding to the median q = 2.40 with ±2σq dispersion, where σq = 0.24, as established by Ivison et al. (2010) for the galaxies in the GOODS-North field, based on the Herschel and VLA observations (also see in this context Magnelli et al. 2015; Delhaize et al. 2017; Giulietti et al. 2022).
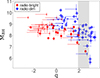 |
Fig. 4. FIR–radio correlation for the analyzed early-type galaxies. Symbols denote the same classes of sources as in Figure 3, except for objects with only upper limit measurements in the FIR, which are marked with stars. Gray shaded area denotes the q-values consistent with the range corresponding q = 2.40 ± 2σq with σq = 0.24 (Ivison et al. 2010). |
It follows from the figure that all sources in the radio-bright sample are indeed over-luminous in the radio relative to their FIR and radio colors. A substantial fraction of the radio-dim sources however exhibit the same behavior, particularly those hosting black holes with masses log MBH/M⊙ ≳ 8.5. Nevertheless, many radio-dim sources do fall within the star-forming region of the diagram, with some even showing unusually high q values.
5. Discussion
While radio-bright sources exhibit radio emission dominated by synchrotron radiation from a spatially resolved jet, radio-dim systems present a more ambiguous case. At the angular resolution of the 3 GHz VLASS observations (2.5 arcsec), the radio-dim sources remain unresolved. In Sect. 4.2, we showed that a subset of our sources exhibits FIR/radio ratios consistent with expectations for star-formation–dominated emission. However, a substantial fraction appears overluminous in the 1.4 GHz band, while remaining unresolved in higher resolution 3 GHz observations.
The physical mechanisms responsible for the compact, low-luminosity radio emission of radio-dim sources therefore remain unclear, suggesting in principle that both star formation and AGN-related processes might be contributing. In the following, we discuss the possible origin of the radio emission in our sample and what mechanisms may give rise to the bimodal distribution of radio luminosities.
5.1. Star-formation and radio emission
In general, early-type galaxies exhibit low star-formation rates, typically ≲0.1 M⊙ yr−1, due to the fact that they tend to be dust- and gas-poor. The most massive ellipticals can reach values of order ∼1 M⊙ yr−1 (Kokusho et al. 2017; Capetti et al. 2022). Even such modest levels of star formation can however produce monochromatic radio luminosities up to ∼1037 erg s−1. Thus, especially in the low-luminosity radio regime ≲1037 erg s−1, the contribution of electrons accelerated in star-forming regions to the total radio emission of early-type systems is never negligible.
Despite this low level of star formation overall, the spatial distribution and intensity of star-formation activity can be highly diverse in early-type systems depending on the exact amount of cold gas present in the ISM. It was shown, for example, by Shapiro et al. (2010) and Kuntschner et al. (2010), that enhanced star formation in nearby early-type galaxies is confined to fast rotators occurring in two distinct modes: (i) widespread young stellar populations associated with substantial molecular gas reservoirs and (ii) more compact star-forming structures arranged in disks or rings (see also Young 2002, 2005; Young et al. 2011). In some cases, the young stars are concentrated toward the central regions (Kuntschner et al. 2010).
More evidence on the dual nature of early-type galaxies follows from the analysis of broadband spectral energy distribution modeling with CIGALEMC code (Serra et al. 2011) by Amblard et al. (2014). Their results revealed a bimodal distribution in the specific star formation rates of early-type galaxies, with lenticular galaxies exhibiting, on average, higher specific star-formation rates and dust luminosities than classical elliptical galaxies. This suggests that residual star formation may be more common and extended in at least a subset of early-type systems, particularly those retaining disk-like structures and molecular gas.
We note that obtaining reliable star formation rates for the early-type galaxies in our sample is of particular importance in distinguishing the source of radio emission in these systems, particularly at the low-luminosity end. These results will be presented in a dedicated follow-up paper (in prep.).
In this context, the q-factor, defined as the FIR-to-radio luminosity ratio (see Equation (3)), provides valuable insight into the dominant contribution of young stars to the total radio emission of a galaxy. As discussed in Section 4.2, a large fraction of our radio-dim sources (in principle, almost all with SMBH masses of log MBH/M⊙ < 8.5) exhibit q-factor values that are consistent with radio emission being indeed dominated by star-forming regions. However, a notable subset of radio-dim sources (in particular, all radio-dim systems with SMBH masses log MBH/M⊙ > 9.0) shows evidence of radio excess, indicating the presence of an additional emission mechanism. Thus, despite the fact that there is compelling evidence for the bimodal nature of the star-formation rate in early-type galaxies, this alone cannot fully explain the observed bimodal distribution in log L1.4 GHz/LEdd; instead, it appears to be linked to the masses of the central SMBHs.
5.2. Role of star–SMBH interaction in triggering radio activity
Launching extended, powerful jets spanning more than hundreds of kiloparsecs (kpc), as observed in some sources, requires a sustained and long-lasting supply of matter to the accretion flow. On the other hand, if the matter supply is more sporadic and arrives in small parcels, the jets will not develop large-scale structures and will instead remain confined to the host galaxy environment.
Indeed, such a mechanism was proposed by Readhead et al. (2024) and further developed by Sullivan et al. (2024) to explain the emission properties of radio galaxies belonging to the compact symmetric object (CSO) class. These systems show a sharp cutoff in the distribution of the linear sizes of their radio structures at ∼500 pc (Kiehlmann et al. 2024a,b), as well as high separation velocities of their terminal hotspots that imply short jet lifetimes. It has been proposed that the radio jets in such sources may be triggered by a single tidal disruption event (TDE); for example, the disruption of a giant-branch star in the vicinity of the central supermassive black hole.
As argued by Sullivan et al. (2024, see Section 5 therein), if the disrupted star carries an average magnetic field of ≳100 G and passes only within ∼100 gravitational radii from a SMBH, the event could still supply sufficient magnetic flux to seed jet formation and power outflows with luminosities on the order of ∼1033 erg s−1 via the Blandford & Znajek (1977) mechanism. The subsequent evolution of the infalling debris could possibly further amplify the magnetic field near the SMBH, providing additional fuel supply capable of powering even the most luminous CSO sources. In our case, we are considering radio-dim systems unresolved at radio frequencies (on arcsecond scales), with black-hole masses of MBH ∼ (109 − 1010) M⊙ and integrated 1.4-GHz luminosities of L1.4 GHz ∼ (10−12 − 10−9) LEdd ∼ 1035 − 1039 erg s−1, which are far below the radio luminosities of the classic CSOs discussed by Readhead et al. (2024) and Sullivan et al. (2024), along with q parameters indicating radio emission in excess of that expected from ongoing star formation. We find that the required energetic output is modest enough to be supplied by such TDE-driven, short-lived jet episodes.
5.3. Merger history of host galaxies
Some information on the merger history of the host galaxy can be assessed via an analysis of their (starlight) luminosity profiles. In particular, some luminous early-type galaxies exhibit partially depleted stellar cores, observed as a flattening of the luminosity profile in the inner region (Graham et al. 2003). A widely favored explanation for this feature involves the presence of a supermassive binary black hole, which ejects stars into radial orbits via three-body interactions (Begelman et al. 1980; Ebisuzaki et al. 1991; Quinlan 1996; Yu 2002; Merritt & Milosavljević 2005). In our sample, only 12 of the 35 radio-dim galaxies with well-characterized luminosity profiles show evidence of core depletion, while 7 of 11 radio-bright galaxies with studied luminosity profiles possess depleted cores (see Savorgnan et al. 2016; Davis et al. 2019; Sahu et al. 2019a).
Another valuable piece of information on the violent past of some early-type galaxies can also be obtained from their internal kinematics. The ATLAS3D survey of a volume-limited sample of local early-type galaxies found that most of them exhibit significant rotation along their major axes (Cappellari et al. 2011a,b; Emsellem et al. 2011; Krajnović et al. 2011). Of the 35 galaxies from our sample included in ATLAS3D, 29 are radio-dim and only 6 are radio-bright. Among the radio-bright subsample, 50% of the galaxies are classified as fast rotators, while 22 out of 29 radio-dim galaxies (76%) fall into this category.
Although radio-bright sources are generally under-represented in such surveys, these statistics suggest that radio-dim galaxies are preferentially associated with fast-rotating systems. Thus, they are more likely to lack depleted cores, pointing to their less violent merger history.
5.4. MBH − σ* scaling relation
The observed strong correlation between dynamically measured black hole masses, MBH, and the stellar velocity dispersion within the effective radius of host galaxies, σ*, is considered to be a clear manifestation of the co-evolution of central SMBHs and their hosts. Since its discovery (Gebhardt et al. 2000; Ferrarese & Merritt 2000), significant efforts have been devoted to calibrating and understanding this correlation (e.g., van den Bosch 2016; Sahu et al. 2019a; Baldassare et al. 2020).
Recently, Smethurst et al. (2024) used the output from the Horizon-AGN simulation to show that galaxies experiencing more than three mergers since a redshift of z = 2 exhibit a shallower correlation slope, whereas isolated galaxies are less tightly correlated and on average have steeper slopes. Similarly, Beckmann et al. (2023) reported that galaxies undergoing recent mergers tend to have lower spin values compared with those evolving in isolation.
Motivated by these findings, we examined the role of mergers and BH spin in shaping the observed radio-dim and radio-bright bimodality by analyzing the slopes of the respective MBH − σ* correlations. In Figure 5, we plot the MBH − σ* relation for our sample of early-type galaxies separated by radio-dim (blue) and radio-bright (red). Interestingly, the bimodality in our dataset is also reflected in the slightly different correlations of the two classes of objects in the MBH − σ* diagram. To quantify this difference, we performed a univariate linear regression analysis using the APEMoST algorithm8 (Gruberbauer et al. 2009), with the response variable Y = log10 MBH and the predictor variable X = log10(σ★/200 km s−1). We assumed a linear trend of
 (4)
(4)
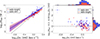 |
Fig. 5. Left panel: Relation between black hole mass (log10 MBH) and stellar velocity dispersion (log10(σ*/200 km s−1)) for the early-type galaxies in our sample. Radio-dim sources are shown as blue diamonds and radio-bright sources as red circles and their corresponding regression lines plotted as solid lines with shaded areas indicating 95% credibility intervals. The black dashed line shows the regression obtained by Graham & Scott (2013) for their full sample of 77 galaxies. Right panel: Scatter of the radio-dim and radio-bright sources from the mean regression line obtained by Graham & Scott (2013) as a function of velocity dispersion. The projected histograms of the source distributions along both axes are presented with the same color scheme for the two radio sub-types. |
where the noise term ϵ is normally distributed, ϵ ∼ 𝒩(0, σ). The standard deviation of the noise is expressed as
 (5)
(5)
with N = 46 and N = 71 for the radio-bright and radio-dim samples, respectively. Here, σint represents the intrinsic scatter, while σXi and σYi denote the respective measurement uncertainties associated with Xi and Yi. The aim here is to determine the multidimensional probability density function (PDF) of the parameter set θ = a, b, σint.
Following Ostorero et al. (2017) and Wójtowicz et al. (2021), we performed 2 × 10⁶ MCMC iterations with 20 chains to ensure a robust sampling of the parameter space. The resulting regression parameters are presented in Table 2.
Summary of Bayesian linear regression analysis for radio-dim and -bright subsamples.
Our analysis offers hints that the radio-dim and radio-bright sources might occupy different loci on the MBH–σ* plane, although the substantial scatter within each subset limits the statistical significance. What we do see, in particular, is that radio-bright objects from our sample follow a shallower correlation than the one observed in radio-dim objects. Looking at the right panel of Figure 5, we see that (to first order) the radio-bright galaxies follow the mean MBH–σ* relation of Graham & Scott (2013), whereas the radio-dim sources tend to lie slightly above that scaling. This suggests that the SMBHs in the radio-dim systems are, on average, overmassive relative to the stellar velocity dispersion of their hosts, compared to the general galaxy population used by Graham & Scott (2013).
For context, the Graham & Scott (2013) relation is based on a sample of 77 nearby galaxies with reliably measured SMBH masses and host-galaxy velocity dispersions. Their best-fitting power-law slope for this full sample, as well as for a refined subsample of 72 galaxies comprising 24 core-Sersic and 48 Sersic spheroids, is b = 6.08 ± 0.41 and 6.08 ± 0.31, respectively. The sample spans a wide range of morphological types, including ellipticals, lenticulars, and spiral bulges, making it a broadly representative reference set for “normal” galaxies.
It is interesting to note in this context the recent findings of Gliozzi et al. (2024), who reported that AGNs in their sample produce a shallower MBH–σ* correlation than that obtained for quiescent galaxies (Kormendy & Ho 2013). A similar behavior is seen in our dataset: the radio-dim galaxies presented in this paper yield a steeper correlation than the mean regression line of Graham & Scott (2013), whereas the radio-bright objects produce a comparatively shallower slope.
6. Conclusions
We investigated the distribution of Eddington-scaled radio luminosities among 117 nearby early-type galaxies with directly measured black hole masses. Using integrated 1.4 GHz flux densities and a sample that was approximately twice as large as that analyzed in Wójtowicz et al. (2023), we confirm a bimodality in the L1.4 GHz/LEdd distribution, with peaks separated at log(L1.4 GHz/LEdd)≈ − 8.6, dividing our sample into radio-dim (log(L1.4 GHz/LEdd)≤ − 8.6) and radio-bright (log(L1.4 GHz/LEdd) > − 8.6) objects. However, this structure is only recovered when using dynamical black hole masses and is washed out when masses from the MBH − σ★ relation are adopted or only a 3 GHz core luminosity is included.
High-resolution VLASS 3 GHz imaging shows that the radio-bright subset consists almost exclusively of galaxies hosting spatially extended jets, while radio-dim systems typically display compact nuclear emission. Many radio-dim galaxies, in particular those associated with the most massive black holes, still exhibit a radio excess relative to the FIR–radio correlation, indicating that the radio emission cannot be produced solely by star-forming processes, but must instead be dominated by mechanisms associated with SMBH activity.
The two radio populations appear to differ in their host-galaxy structural properties: the radio-bright systems are predominantly slow rotators with depleted stellar cores, whereas the radio-dim systems are mostly fast rotators. This distinction is further supported by their separation on the MBH–σ* plane, where the radio-dim sources exhibit a steeper regression slope than that obtained for the radio-bright objects. Moreover, when compared with the general population of normal galaxies of various morphological types studied by Graham & Scott (2013), the radio-dim systems appear, on average, to host overmassive SMBHs relative to their stellar velocity dispersions.
In our view, this points toward a scenario in which the radio-dim systems represent the low-energy tail of the radio-luminosity distribution normalized by SMBH mass in early-type galaxies. Their radio output likely reflects modest, intermittent supplies of magnetized gas delivered to the accretion flow through stochastic processes, most plausibly the tidal disruption of giant-branch stars passing through the immediate vicinity of the SMBH. Because the mass supply in such events is relatively uniform, the resulting accretion episodes produce broadly similar levels of radio emission across early-type systems. The observed bimodality in the Eddington-normalized radio-luminosity distribution would then arise primarily from the fact that a subset of fast rotators host overmassive black holes.
If correct, this scenario offers a coherent physical explanation for the bimodality in Eddington-normalized radio power at the lowest, rarely probed luminosity range in early-type galaxies. It would link SMBH radio output to stellar kinematic class and black-hole overmassiveness, while identifying stochastic stellar-disruption events as a universal fueling channel for low-level radio activity in these systems.
Acknowledgments
A. W. and N. W. were supported by the GACR grant 21-13491X. Research by C. C. C. at the Naval Research Laboratory is supported by NASA DPR S-15633-Y.
References
- Allison, J. R., Sadler, E. M., & Meekin, A. M. 2014, MNRAS, 440, 696 [Google Scholar]
- Amblard, A., Riguccini, L., Temi, P., et al. 2014, ApJ, 783, 135 [Google Scholar]
- Baldassare, V. F., Dickey, C., Geha, M., et al. 2020, ApJ, 898, L3 [NASA ADS] [CrossRef] [Google Scholar]
- Beckmann, R. S., Dubois, Y., Volonteri, M., et al. 2023, MNRAS, 523, 5610 [NASA ADS] [CrossRef] [Google Scholar]
- Begelman, M. C., Blandford, R. D., & Rees, M. J. 1980, Nature, 287, 307 [Google Scholar]
- Bender, R., Surma, P., Doebereiner, S., et al. 1989, A&A, 217, 35 [NASA ADS] [Google Scholar]
- Bentz, M. C., & Manne-Nicholas, E. 2018, ApJ, 864, 146 [NASA ADS] [CrossRef] [Google Scholar]
- Bîrzan, L., Rafferty, D. A., McNamara, B. R., et al. 2004, ApJ, 607, 800 [CrossRef] [Google Scholar]
- Blandford, R. D., & Znajek, R. L. 1977, MNRAS, 179, 433 [NASA ADS] [CrossRef] [Google Scholar]
- Blandford, R., Meier, D., & Readhead, A. 2019, ARA&A, 57, 467 [NASA ADS] [CrossRef] [Google Scholar]
- Brough, S., Proctor, R., Forbes, D. A., et al. 2007, MNRAS, 378, 1507 [NASA ADS] [CrossRef] [Google Scholar]
- Brown, M. J. I., Jannuzi, B. T., Floyd, D. J. E., et al. 2011, ApJ, 731, L41 [Google Scholar]
- Capetti, A., Brienza, M., Balmaverde, B., et al. 2022, A&A, 660, A93 [NASA ADS] [CrossRef] [EDP Sciences] [Google Scholar]
- Cappellari, M., Emsellem, E., Bacon, R., et al. 2007, MNRAS, 379, 418 [Google Scholar]
- Cappellari, M., Emsellem, E., Krajnović, D., et al. 2011a, MNRAS, 413, 813 [Google Scholar]
- Cappellari, M., Emsellem, E., Krajnović, D., et al. 2011b, MNRAS, 416, 1680 [Google Scholar]
- Condon, J. J., Cotton, W. D., Greisen, E. W., et al. 1998, AJ, 115, 1693 [Google Scholar]
- Condon, J. J., Cotton, W. D., & Broderick, J. J. 2002, AJ, 124, 675 [Google Scholar]
- Cooper, B. F. C., Price, R. M., & Cole, D. J. 1965, Aust. J. Phys., 18, 589 [NASA ADS] [Google Scholar]
- Dasyra, K. M., Tacconi, L. J., Davies, R. I., et al. 2007, ApJ, 657, 102 [NASA ADS] [CrossRef] [Google Scholar]
- Davis, B. L., Graham, A. W., & Cameron, E. 2019, ApJ, 873, 85 [NASA ADS] [CrossRef] [Google Scholar]
- Delhaize, J., Smolčić, V., Delvecchio, I., et al. 2017, A&A, 602, A4 [NASA ADS] [CrossRef] [EDP Sciences] [Google Scholar]
- den Brok, M., Krajnović, D., Emsellem, E., et al. 2021, MNRAS, 508, 4786 [NASA ADS] [CrossRef] [Google Scholar]
- Diniz, S. I. F., Pastoriza, M. G., Hernandez-Jimenez, J. A., et al. 2017, MNRAS, 470, 1703 [Google Scholar]
- Drton, M., & Plummer, M. 2017, J. R. Stat. Soc. B, 79, 2 [Google Scholar]
- Dunlop, J. S., McLure, R. J., Kukula, M. J., et al. 2003, MNRAS, 340, 1095 [NASA ADS] [CrossRef] [Google Scholar]
- Ebisuzaki, T., Makino, J., & Okumura, S. K. 1991, Nature, 354, 212 [NASA ADS] [CrossRef] [Google Scholar]
- Emsellem, E., Cappellari, M., Krajnović, D., et al. 2007, MNRAS, 379, 401 [Google Scholar]
- Emsellem, E., Cappellari, M., Krajnović, D., et al. 2011, MNRAS, 414, 888 [Google Scholar]
- Faber, S. M., Tremaine, S., Ajhar, E. A., et al. 1997, AJ, 114, 1771 [NASA ADS] [CrossRef] [Google Scholar]
- Ferrarese, L., & Merritt, D. 2000, ApJ, 539, L9 [Google Scholar]
- Floyd, D. J. E., Kukula, M. J., Dunlop, J. S., et al. 2004, MNRAS, 355, 196 [NASA ADS] [CrossRef] [Google Scholar]
- Gaspari, M., Eckert, D., Ettori, S., et al. 2019, ApJ, 884, 169 [NASA ADS] [CrossRef] [Google Scholar]
- Gebhardt, K., Bender, R., Bower, G., et al. 2000, ApJ, 539, L13 [Google Scholar]
- Giulietti, M., Massardi, M., Lapi, A., et al. 2022, MNRAS, 511, 1408 [NASA ADS] [Google Scholar]
- Gliozzi, M., Williams, J. K., Akylas, A., et al. 2024, MNRAS, 528, 3417 [NASA ADS] [CrossRef] [Google Scholar]
- Golombek, D., Miley, G. K., & Neugebauer, G. 1988, AJ, 95, 26 [Google Scholar]
- Graham, A. W., & Scott, N. 2013, ApJ, 764, 151 [Google Scholar]
- Graham, A. W., Erwin, P., Trujillo, I., et al. 2003, AJ, 125, 2951 [CrossRef] [Google Scholar]
- Gruberbauer, M., Kallinger, T., Weiss, W. W., et al. 2009, A&A, 506, 1043 [NASA ADS] [CrossRef] [EDP Sciences] [Google Scholar]
- Helou, G., Soifer, B. T., & Rowan-Robinson, M. 1985, ApJ, 298, L7 [Google Scholar]
- Ivison, R. J., Magnelli, B., Ibar, E., et al. 2010, A&A, 518, L31 [NASA ADS] [CrossRef] [EDP Sciences] [Google Scholar]
- Jarrett, T. H., Cohen, M., Masci, F., et al. 2011, ApJ, 735, 112 [Google Scholar]
- Jarrett, T. H., Cluver, M. E., Brown, M. J. I., et al. 2019, ApJS, 245, 25 [Google Scholar]
- Kabasares, K. M., Barth, A. J., Buote, D. A., et al. 2022, ApJ, 934, 162 [NASA ADS] [CrossRef] [Google Scholar]
- Kellermann, K. I., Sramek, R., Schmidt, M., et al. 1989, AJ, 98, 1195 [NASA ADS] [CrossRef] [Google Scholar]
- Kiehlmann, S., Lister, M. L., Readhead, A. C. S., et al. 2024a, ApJ, 961, 240 [NASA ADS] [CrossRef] [Google Scholar]
- Kiehlmann, S., Readhead, A. C. S., O’Neill, S., et al. 2024b, ApJ, 961, 241 [NASA ADS] [CrossRef] [Google Scholar]
- Knapp, G. R., Guhathakurta, P., Kim, D.-W., et al. 1989, ApJS, 70, 329 [Google Scholar]
- Kokusho, T., Kaneda, H., Bureau, M., et al. 2017, A&A, 605, A74 [NASA ADS] [CrossRef] [EDP Sciences] [Google Scholar]
- Komissarov, S., & Porth, O. 2021, New Astron. Rev., 92, 101610 [Google Scholar]
- Kormendy, J., & Ho, L. C. 2013, ARA&A, 51, 511 [Google Scholar]
- Krajnović, D., Emsellem, E., Cappellari, M., et al. 2011, MNRAS, 414, 2923 [Google Scholar]
- Kuntschner, H., Lucey, J. R., Smith, R. J., et al. 2001, MNRAS, 323, 615 [NASA ADS] [CrossRef] [Google Scholar]
- Kuntschner, H., Emsellem, E., Bacon, R., et al. 2010, MNRAS, 408, 97 [Google Scholar]
- Liepold, C. M., Quenneville, M. E., Ma, C.-P., et al. 2020, ApJ, 891, 4 [NASA ADS] [CrossRef] [Google Scholar]
- Magnelli, B., Ivison, R. J., Lutz, D., et al. 2015, A&A, 573, A45 [NASA ADS] [CrossRef] [EDP Sciences] [Google Scholar]
- Mateos, S., Alonso-Herrero, A., Carrera, F. J., et al. 2012, MNRAS, 426, 3271 [Google Scholar]
- McLure, R. J., Kukula, M. J., Dunlop, J. S., et al. 1999, MNRAS, 308, 377 [CrossRef] [Google Scholar]
- Mehrgan, K., Thomas, J., Saglia, R., et al. 2019, ApJ, 887, 195 [NASA ADS] [CrossRef] [Google Scholar]
- Merritt, D., & Milosavljević, M. 2005, Liv. Rev. Relat., 8, 8 [NASA ADS] [Google Scholar]
- Moshir, M., Kopan, G., Conrow, T., et al. 2008, VizieR Online Data Catalog: II/275 [Google Scholar]
- Narayan, R., & McClintock, J. E. 2012, MNRAS, 419, L69 [CrossRef] [Google Scholar]
- Nyland, K., Young, L. M., Wrobel, J. M., et al. 2017, MNRAS, 464, 1029 [Google Scholar]
- Ostorero, L., Morganti, R., Diaferio, A., et al. 2017, ApJ, 849, 34 [CrossRef] [Google Scholar]
- Panessa, F., Baldi, R. D., Laor, A., et al. 2019, Nat. Astron., 3, 387 [Google Scholar]
- Pilawa, J. D., Liepold, C. M., Delgado Andrade, S. C., et al. 2022, ApJ, 928, 178 [NASA ADS] [CrossRef] [Google Scholar]
- Quinlan, G. D. 1996, New Astron., 1, 35 [Google Scholar]
- Readhead, A. C. S., Ravi, V., Blandford, R. D., et al. 2024, ApJ, 961, 242 [Google Scholar]
- Reynolds, C. S. 2021, ARA&A, 59, 117 [NASA ADS] [CrossRef] [Google Scholar]
- Ricci, T. V., & Steiner, J. E. 2020, MNRAS, 495, 2620 [Google Scholar]
- Ricci, T. V., Steiner, J. E., & Menezes, R. B. 2016, MNRAS, 463, 3860 [Google Scholar]
- Rice, W., Lonsdale, C. J., Soifer, B. T., et al. 1988, ApJS, 68, 91 [NASA ADS] [CrossRef] [Google Scholar]
- Saglia, R. P., Opitsch, M., Erwin, P., et al. 2016, ApJ, 818, 47 [Google Scholar]
- Sahu, N., Graham, A. W., & Davis, B. L. 2019a, ApJ, 876, 155 [NASA ADS] [CrossRef] [Google Scholar]
- Sahu, N., Graham, A. W., & Davis, B. L. 2019b, ApJ, 887, 10 [CrossRef] [Google Scholar]
- Sanders, D. B., Phinney, E. S., Neugebauer, G., et al. 1989, ApJ, 347, 29 [Google Scholar]
- Savorgnan, G. A. D., Graham, A. W., Marconi, A., et al. 2016, ApJ, 817, 21 [NASA ADS] [CrossRef] [Google Scholar]
- Schilling, M., Watkins, A., & Watkins, W. 2002, Am. Stat., 56, 223 [Google Scholar]
- Serra, P., Amblard, A., Temi, P., et al. 2011, ApJ, 740, 22 [Google Scholar]
- Shapiro, K. L., Falcón-Barroso, J., van de Ven, G., et al. 2010, MNRAS, 402, 2140 [NASA ADS] [CrossRef] [Google Scholar]
- Smethurst, R. J., Beckmann, R. S., Simmons, B. D., et al. 2024, MNRAS, 527, 10855 [Google Scholar]
- Stern, D., Assef, R. J., Benford, D. J., et al. 2012, ApJ, 753, 30 [Google Scholar]
- Sullivan, A. G., Blandford, R. D., Begelman, M. C., et al. 2024, MNRAS, 528, 6302 [NASA ADS] [CrossRef] [Google Scholar]
- Tadhunter, C. 2016, A&ARv, 24, 10 [Google Scholar]
- Thater, S., Krajnović, D., Cappellari, M., et al. 2019, A&A, 625, A62 [NASA ADS] [CrossRef] [EDP Sciences] [Google Scholar]
- Thater, S., Krajnović, D., Weilbacher, P. M., et al. 2022, MNRAS, 509, 5416 [Google Scholar]
- van den Bosch, R. C. E. 2016, ApJ, 831, 134 [NASA ADS] [CrossRef] [Google Scholar]
- Vanderbeke, J., Baes, M., Romanowsky, A. J., et al. 2011, MNRAS, 412, 2017 [NASA ADS] [CrossRef] [Google Scholar]
- Veale, M., Ma, C.-P., Greene, J. E., et al. 2018, MNRAS, 473, 5446 [Google Scholar]
- Watson, L. C., Martini, P., Dasyra, K. M., et al. 2008, ApJ, 682, L21 [NASA ADS] [CrossRef] [Google Scholar]
- White, R. L., & Becker, R. H. 1992, ApJS, 79, 331 [NASA ADS] [CrossRef] [Google Scholar]
- Wójtowicz, A., Stawarz, Ł., Machalski, J., et al. 2021, ApJ, 922, 197 [Google Scholar]
- Wójtowicz, A., Stawarz, Ł., Cheung, C. C., et al. 2023, ApJ, 944, 195 [CrossRef] [Google Scholar]
- Young, L. M. 2002, AJ, 124, 788 [NASA ADS] [CrossRef] [Google Scholar]
- Young, L. M. 2005, ApJ, 634, 258 [Google Scholar]
- Young, L. M., Bureau, M., Davis, T. A., et al. 2011, MNRAS, 414, 940 [NASA ADS] [CrossRef] [Google Scholar]
- Yu, Q. 2002, MNRAS, 331, 935 [Google Scholar]
- Yu, L.-M., Bian, W.-H., Wang, C., et al. 2019, MNRAS, 488, 1519 [Google Scholar]
Automated Parameter Estimation and Model Selection Toolkit; http://apemost.sourceforge.net/, 2011 February.
Appendix A: The sample
Radio and IR data for radio-detected early-type galaxies
Appendix B: WISE data
WISE colors of radio-bright (left) and radio-dim objects (right) based on magnitudes measured with profile-fitting photometry in the WISE All-Sky Survey catalog.
Appendix C: FIR data
Information on the measured FIR fluxes for all sources observed by the IRAS satellite.
Information on the FIR fluxes for sources with only upper limit estimates measured by the IRAS satellite.
All Tables
Summary of Bayesian linear regression analysis for radio-dim and -bright subsamples.
WISE colors of radio-bright (left) and radio-dim objects (right) based on magnitudes measured with profile-fitting photometry in the WISE All-Sky Survey catalog.
Information on the measured FIR fluxes for all sources observed by the IRAS satellite.
Information on the FIR fluxes for sources with only upper limit estimates measured by the IRAS satellite.
All Figures
|
Fig. 1. Histogram showing the distribution of log10 MBH for sources presented in this work in red, Wójtowicz et al. (2023) in white, and early-type sources from van den Bosch (2016) in green in the top-right. Distribution of source distances (in Mpc), plotted on a logarithmic scale using the same color scheme in the top-left. The bottom-right and bottom-left histograms show the distributions of log10 L1.4 and L1.4 GHz/LEdd for sources from Wójtowicz et al. (2023) in white and this work in red, respectively. |
| In the text | |
|
Fig. 2. Left: histogram of integrated 1.4 GHz radio luminosity expressed in Eddington units, estimated using BH masses determined via direct methods. The position of the antimode at log L1.4 GHz/LEdd = −8.6, identified using the locmodes function, is indicated by a black vertical line. Right: Same as the left panel, but using BH masses estimated indirectly from the MBH − σ* relation of Graham & Scott (2013). The vertical line indicates the position of the antimode at log L1.4 GHz/LEdd = −8.6. |
| In the text | |
|
Fig. 3. WISE color-color diagram for the analyzed early-type galaxies. Sources belonging to the radio-dim and radio-bright classes are denoted as open blue diamonds and filled red circles respectively. The dashed line indicates the star formation sequence, as in Equation (2). |
| In the text | |
|
Fig. 4. FIR–radio correlation for the analyzed early-type galaxies. Symbols denote the same classes of sources as in Figure 3, except for objects with only upper limit measurements in the FIR, which are marked with stars. Gray shaded area denotes the q-values consistent with the range corresponding q = 2.40 ± 2σq with σq = 0.24 (Ivison et al. 2010). |
| In the text | |
|
Fig. 5. Left panel: Relation between black hole mass (log10 MBH) and stellar velocity dispersion (log10(σ*/200 km s−1)) for the early-type galaxies in our sample. Radio-dim sources are shown as blue diamonds and radio-bright sources as red circles and their corresponding regression lines plotted as solid lines with shaded areas indicating 95% credibility intervals. The black dashed line shows the regression obtained by Graham & Scott (2013) for their full sample of 77 galaxies. Right panel: Scatter of the radio-dim and radio-bright sources from the mean regression line obtained by Graham & Scott (2013) as a function of velocity dispersion. The projected histograms of the source distributions along both axes are presented with the same color scheme for the two radio sub-types. |
| In the text | |
Current usage metrics show cumulative count of Article Views (full-text article views including HTML views, PDF and ePub downloads, according to the available data) and Abstracts Views on Vision4Press platform.
Data correspond to usage on the plateform after 2015. The current usage metrics is available 48-96 hours after online publication and is updated daily on week days.
Initial download of the metrics may take a while.