Fig. 2.
Download original image
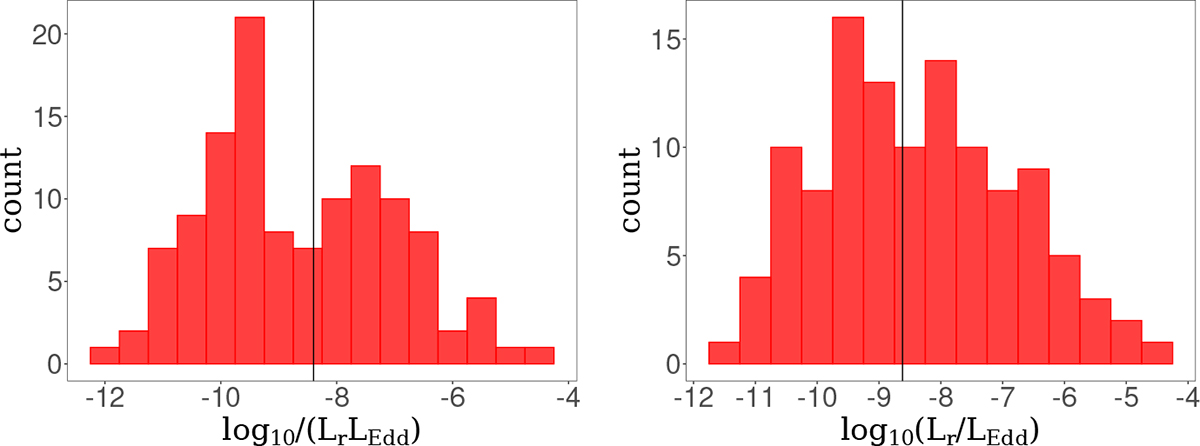
Left: histogram of integrated 1.4 GHz radio luminosity expressed in Eddington units, estimated using BH masses determined via direct methods. The position of the antimode at log L1.4 GHz/LEdd = −8.6, identified using the locmodes function, is indicated by a black vertical line. Right: Same as the left panel, but using BH masses estimated indirectly from the MBH − σ* relation of Graham & Scott (2013). The vertical line indicates the position of the antimode at log L1.4 GHz/LEdd = −8.6.
Current usage metrics show cumulative count of Article Views (full-text article views including HTML views, PDF and ePub downloads, according to the available data) and Abstracts Views on Vision4Press platform.
Data correspond to usage on the plateform after 2015. The current usage metrics is available 48-96 hours after online publication and is updated daily on week days.
Initial download of the metrics may take a while.