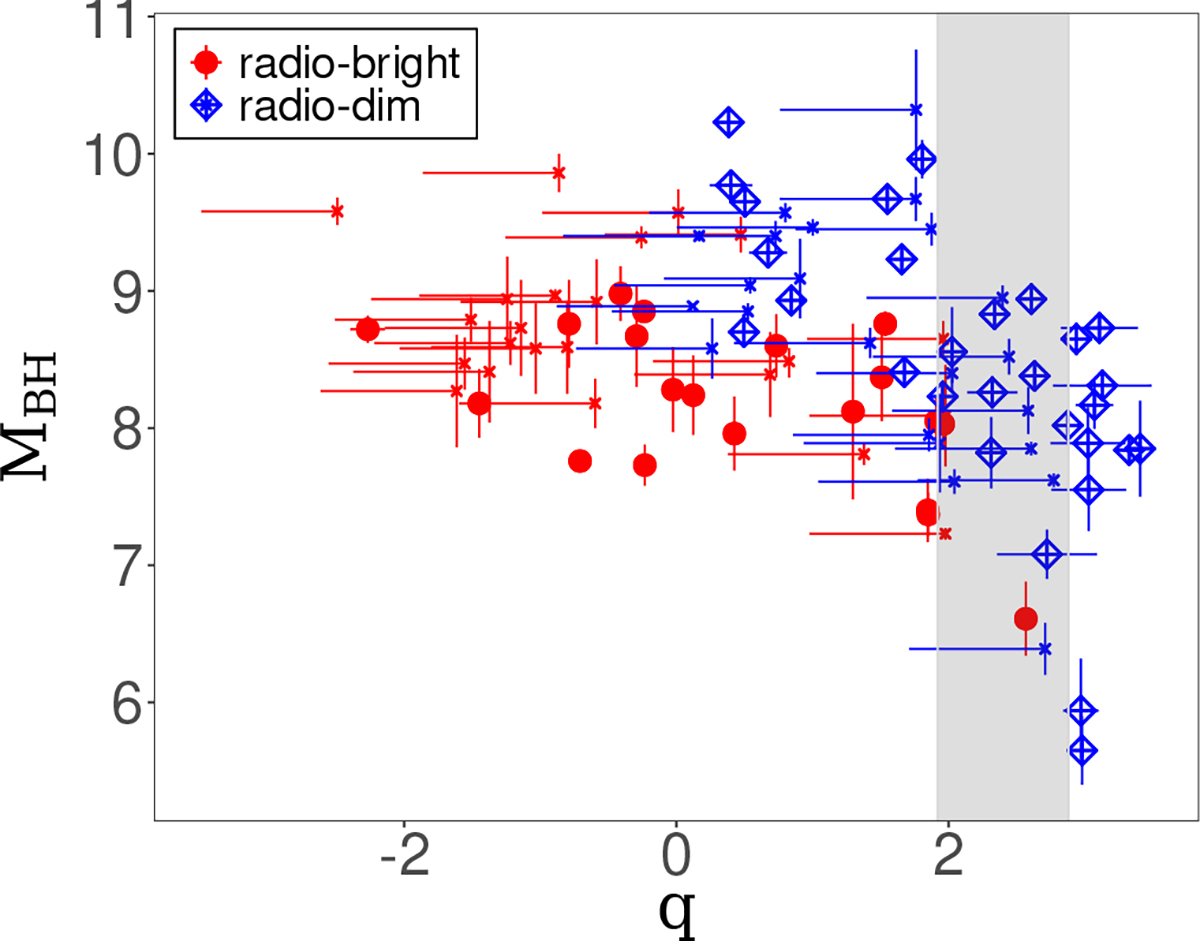
Fig. 4.
Download original image
FIR–radio correlation for the analyzed early-type galaxies. Symbols denote the same classes of sources as in Figure 3, except for objects with only upper limit measurements in the FIR, which are marked with stars. Gray shaded area denotes the q-values consistent with the range corresponding q = 2.40 ± 2σq with σq = 0.24 (Ivison et al. 2010).
Current usage metrics show cumulative count of Article Views (full-text article views including HTML views, PDF and ePub downloads, according to the available data) and Abstracts Views on Vision4Press platform.
Data correspond to usage on the plateform after 2015. The current usage metrics is available 48-96 hours after online publication and is updated daily on week days.
Initial download of the metrics may take a while.