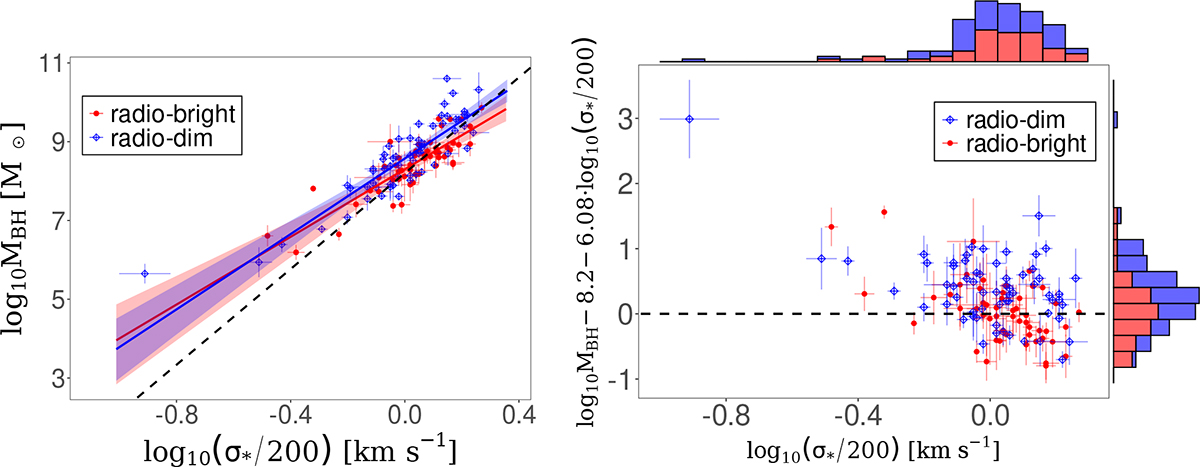
Fig. 5.
Download original image
Left panel: Relation between black hole mass (log10 MBH) and stellar velocity dispersion (log10(σ*/200 km s−1)) for the early-type galaxies in our sample. Radio-dim sources are shown as blue diamonds and radio-bright sources as red circles and their corresponding regression lines plotted as solid lines with shaded areas indicating 95% credibility intervals. The black dashed line shows the regression obtained by Graham & Scott (2013) for their full sample of 77 galaxies. Right panel: Scatter of the radio-dim and radio-bright sources from the mean regression line obtained by Graham & Scott (2013) as a function of velocity dispersion. The projected histograms of the source distributions along both axes are presented with the same color scheme for the two radio sub-types.
Current usage metrics show cumulative count of Article Views (full-text article views including HTML views, PDF and ePub downloads, according to the available data) and Abstracts Views on Vision4Press platform.
Data correspond to usage on the plateform after 2015. The current usage metrics is available 48-96 hours after online publication and is updated daily on week days.
Initial download of the metrics may take a while.