Open Access
Fig. 8
Download original image
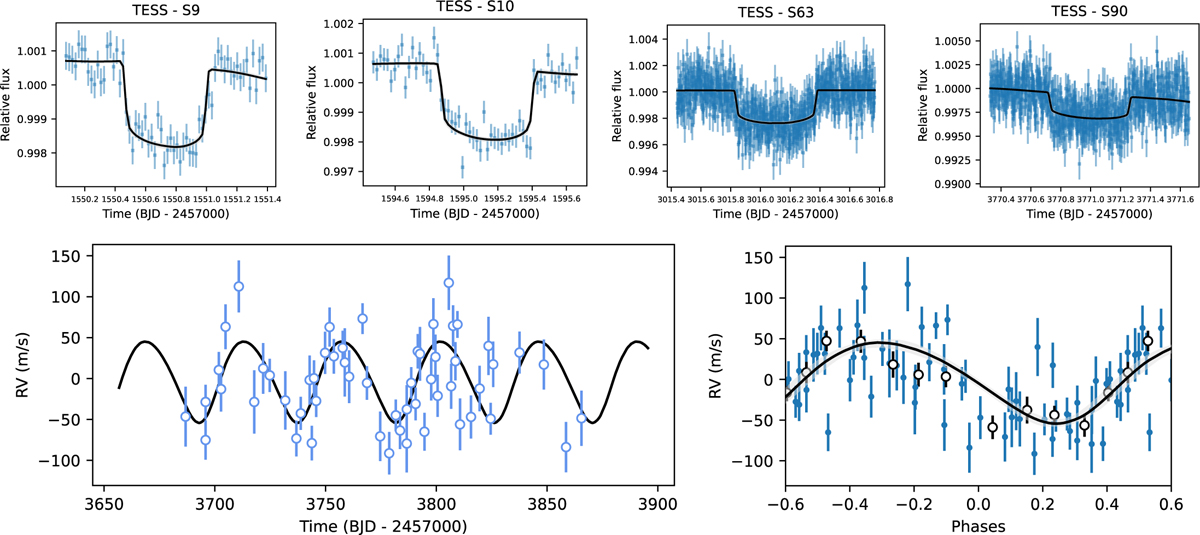
Top: light curves of TIC 147027702 for individual TESS sectors with the best model (black). Bottom: radial velocity time series of TIC 147027702 and phase-folded RV curve with the best model (black). The white points show the binned RV curve.
Current usage metrics show cumulative count of Article Views (full-text article views including HTML views, PDF and ePub downloads, according to the available data) and Abstracts Views on Vision4Press platform.
Data correspond to usage on the plateform after 2015. The current usage metrics is available 48-96 hours after online publication and is updated daily on week days.
Initial download of the metrics may take a while.