| Issue |
A&A
Volume 708, April 2026
|
|
|---|---|---|
| Article Number | A189 | |
| Number of page(s) | 17 | |
| Section | Planets, planetary systems, and small bodies | |
| DOI | https://doi.org/10.1051/0004-6361/202558698 | |
| Published online | 09 April 2026 | |
PLATOSpec first results: Three new transiting warm Jupiters from the WINE survey, TIC 147027702, TIC 245076932, and TIC 87422071
1
Astronomical Institute, Czech Academy of Sciences,
Fričova 298,
25165
Ondřejov,
Czech Republic
2
Institute of Physics, Faculty of Science, Pavol Jozef Šafárik University,
Park Angelinum 9,
04001
Košice,
Slovakia
3
Facultad de Ingeniería y Ciencias, Universidad Adolfo Ibáñez,
Av. Diagonal Las Torres 2640, Peñalolén,
Santiago,
Chile
4
Millennium Institute for Astrophysics,
Av. Vicuna Mackenna 4860,
782-0436
Macul, Santiago,
Chile
5
Max-Planck-Institut für Astronomie,
Königstuhl 17,
69117
Heidelberg,
Germany
6
European Southern Observatory (ESO),
Alonso de Córdova 3107, Vitacura, Casilla
19001,
Santiago,
Chile
7
Astronomical Institute of Charles University,
V Holešovičkách 2,
180 00
Prague,
Czech Republic
8
Department of Theoretical Physics and Astrophysics, Faculty of Science, Masaryk University,
Kotlářská 2,
611 37
Brno,
Czech Republic
9
Université Côte d’Azur, Observatoire de la Côte d’Azur, CNRS,
Laboratoire Lagrange, CS 34229,
06304
Nice Cedex 4,
France
10
Istituto di Scienze Polari del CNR (ISP-CNR), Università Ca’ Foscari,
Via Torino n. 155,
30172
Venezia Mestre (VE),
Italy
11
Programma Nazionale di Ricerche in Antartide (PNRA), Institut polaire français Paul-Émile Victor (IPEV)
12
School of Physics & Astronomy, University of Birmingham, Edgbaston,
Birmingham
B15 2TT,
UK
13
Center for Astrophysics | Harvard & Smithsonian,
60 Garden Street,
Cambridge,
MA
02138,
USA
14
Instituto de Astrofísica de Canarias (IAC), Calle Vía Láctea s/n,
38200
La Laguna, Tenerife,
Spain
15
Astrobiology Research Unit, Université de Liège,
19C Allée du 6 Août,
4000
Liège,
Belgium
16
Department of Earth, Atmospheric and Planetary Science, Massachusetts Institute of Technology,
77 Massachusetts Avenue,
Cambridge,
MA
02139,
USA
17
El Sauce Observatory – Obstech,
Coquimbo,
Chile
18
Cavendish Laboratory,
J. J. Thomson Avenue,
Cambridge,
CB3 0HE,
UK
19
Center of Astro Engineering, Pontificia Universidad Católica de Chile,
Av. Vicuña Mackenna 4860,
782-043
Santiago,
Chile
20
Department of Electrical Engineering, Pontificia Universidad Católica de Chile,
Av. Vicuña Mackenna 4860,
782-043
Santiago,
Chile
21
Thüringer Landessternwarte,
07778
Tautenburg,
Germany
22
Space Telescope Science Institute,
3700 San Martin Drive,
Baltimore,
MD
21218,
USA
23
Department of Physics and Astronomy, The University of New Mexico,
Albuquerque,
NM
87106,
USA
24
Institute of Plasma Physics of the Czech Academy of Sciences, Research Centre for Special Optics and Optoelectronic Systems TOPTEC,
U Slovanky 2525/1a,
182 00
Praha 8,
Czech Republic
25
Instituto de Astrofísica, Pontificia Universidad Católica de Chile,
Av. Vicuña Mackenna 4860,
7820436
Macul, Santiago,
Chile
★ Corresponding author: This email address is being protected from spambots. You need JavaScript enabled to view it.
; This email address is being protected from spambots. You need JavaScript enabled to view it.
Received:
19
December
2025
Accepted:
25
February
2026
Abstract
We report the discovery and characterisation of three transiting warm Jupiters: TIC 147027702b, TIC 245076932b, and TIC 87422071b. These systems were initially identified as transiting candidates using light curves generated from the full-frame images of the TESS mission. We confirmed the planetary nature of these objects with ground-based spectroscopic follow-up observations using FEROS and the new PLATOSpec spectrograph attached to the ESO 1.52 m telescope at the La Silla Observatory, and with ground-based photometric observations of the Observatoire Moana, Las Cumbres Observatory Global Telescope and ASTEP. From a global fit to the photometry and radial velocities, we determine that the planet TIC 147027702b has a low-eccentricity orbit (e = 0.13 ± 0.05) with a period of 44.4 days, a mass of 1.09−0.13+0.07 MJ, and a radius of 0.98 ± 0.06 RJ. TIC 245076932b has a moderately low mass of 0.51 ± 0.05 MJ, a radius of 0.97 ± 0.05 RJ, and an eccentric orbit (e = 0.43 ± 0.02) with a period of 21.6 days. TIC 87422071b has a mass of 1.29 ± 0.10 MJ, a radius of 0.97 ± 0.08 RJ, and a slightly eccentric orbit (e = 0.12 ± 0.07) with a period of 11.3 days. These well-characterised warm Jupiters expand the currently limited sample of similar gas giants and provide valuable benchmarks for testing models of giant-planet formation, migration, and tidal evolution.
Key words: techniques: photometric / techniques: radial velocities / planets and satellites: detection / planets and satellites: gaseous planets / planetary systems
© The Authors 2026
 Open Access article, published by EDP Sciences, under the terms of the Creative Commons Attribution License (https://creativecommons.org/licenses/by/4.0), which permits unrestricted use, distribution, and reproduction in any medium, provided the original work is properly cited.
This article is published in open access under the Subscribe to Open model. This email address is being protected from spambots. You need JavaScript enabled to view it. to support open access publication.
1 Introduction
The number of discovered exoplanets has increased over the years and currently exceeds 6000. The majority of well-characterised giant planets are hot Jupiters, highly irradiated gas planets at extreme proximities from their host stars (e.g. Santerne et al. 2016). These planets are not expected to have formed at their current locations because the formation of planetary cores is highly inefficient inside the snowline (e.g. Rafikov 2005; Schlichting 2014). A possible mechanism for forming the hot Jupiter population is migration from beyond the snowline, either by interactions with the gaseous disc when it is still present or through high-eccentricity tidal migration mechanisms, generated by interactions with other objects in the system after the dispersal of the disc (e.g. Kley & Nelson 2012; Walsh et al. 2011).
Warm giant planets can be perceived as a transition state in the evolution of hot Jupiters. Warm Jupiters are generally defined as planets with masses greater than 0.3 MJ and orbital periods between 10 and 200 days (Dong et al. 2021). Their equilibrium temperatures are below ~1000 K. The observed properties, planetary atmospheres, and physical processes driving the structure of warm Jupiters are less affected by proximity to the host star, which means that they present a unique opportunity to test planetary system formation and evolution theories. However, the number of discovered and well-characterised transiting warm giant planets is small and currently is about 1001.
We present the discovery, confirmation, and characterisation of three new transiting planets belonging to the class of warm Jupiters. They were identified as planetary candidates from the Transiting Exoplanet Survey Satellite light curves (TESS; Ricker et al. 2015) and confirmed by follow-up radial velocity (RV) measurement using the PLATOSpec spectrograph (Kabáth et al. 2026). In addition, we performed ground-based photometric observations to confirm the true source of the transit signal.
This paper is organised as follows. We describe the photometric and spectroscopic observations we used in Sect. 2. Sect. 3 presents the stellar parameters of the parent star. In Sect. 4, we provide the parameters of the planetary system obtained by our analysis. Finally, we discuss our results and draw conclusions in Sect. 5.
2 Observations
2.1 TESS photometry
The source TIC 147027702b was identified as a transiting-planet candidate from the full-frame image (FFI) light curves of the TESS mission using a transformer-based algorithm (Salinas et al. 2025) in the context of the Warm gIaNts with tEss collaboration (WINE; Brahm et al. 2019; Jordán et al. 2020; Schlecker et al. 2020; Trifonov et al. 2021; Hobson et al. 2023; Eberhardt et al. 2023; Jones et al. 2024; Tala Pinto et al. 2025). The candidate was marked as a single transiter based on the observation from Sector 9 (March 2019). A posterior analysis revealed three additional transits in Sectors 10 (April 2019), 63 (March 2023), and 90 (March 2025). This target was also observed by TESS in Sector 36 (March 2021), but no transit occurred during that period. For the first two sectors (S9 and S10), the FFIs were collected with a cadence of 30 min. In Sectors 63 and 90, the cadence was changed to 200 seconds. The time series of these sectors are shown in Fig. 2. From these four TESS light curves, it was possible to constrain the orbital period of the transiting candidate to P≈44.4 d. The transit depth of δ ≈ 2200 ppm is therefore consistent with that of a possible warm giant planet.
Using a similar approach, we identified a new transiting candidate on the star TIC 245076932. However, multiple transits were detected in the light curves of the TESS primary mission, and the orbital period of the planetary candidate was estimated to be 21.6 days by Salinas et al. (2025). TESS observed this target during four sectors: Sector 11 (May 2019), Sector 37 (April 2021), Sector 38 (May 2021), and Sector 64 (April 2023). The cadence of the FFIs in Sector 11 was 30 min. It was changed to 10 min in Sectors 37 and 38 and to 200 s in Sector 64. From their time series (Fig. 3), we identified five full transits with a depth of δ ≈ 5990 ppm. An additional partial transit was observed in Sector 11, where only the end of the egress is captured.
The source TIC 87422071 was identified as a planetary candidate with an orbital period of 11.36 days from the TESS quick-look pipeline (QLP, Huang et al. 2020). Seven transits in three TESS sectors (Fig. 4) were identified with a depth of δ ≈ 4470 ppm. Sector 13 (July 2019) has an FFI cadence of 30 min. An additional two sectors, Sector 66 (June 2023) and Sector 93 (June 2025), were taken with a 200 s cadence.
Some additional out-of-transit variability can be observed in the LCs for each target, which varies between individual sectors. It is mainly the result of systematic trends in TESS data. There are significant differences in the amount of detrending when the data products are compared (QLP or SPOC). The SPOC pipeline eliminates most of the additional trends. Stellar variability (e.g. pulsations or stellar spots) has probably less of an effect in our case.
We analysed the target-pixel files (TPFs) for possible contamination from other sources. We used tpfplotter (Aller et al. 2020) for this purpose. Figure 1 shows the TPF for all three targets. No neighbouring stars lie inside the aperture mask of TIC 147027702. Only a few fainter stars (with a brightness difference of more than 2 mag) were identified in the background, with an angular separation from the target of at least 1.5′. Inside the aperture mask of TIC 245076932, multiple faint stars can be identified. However, the brightness difference is 3 to 5 mag. TIC 87422071 has a close bright neighbour. The star TIC 87422067 (Gaia DR3 6721152024675106816) is separated by only 12”, with a V mag of 12.82 (compared to 11.98 of our target). Ground-based photometry was therefore necessary to prove the real source of the transiting signal. The additional three stars that are fainter than 15.5 mag are present in its aperture mask.
2.2 Ground-based photometry
We acquired ground-based photometric observations to confirm the true source of the transit signal. For this purpose, we used multiple telescopes in various observatories.
The Observatoire Moana (OM) is a global network of small-aperture robotic optical telescopes. The station installed at the EL Sauce observatory in Chile consists of a 0.6 m Dall-Kirkham robotic telescope coupled to an Andor iKon-L 936 deep depletion 2k × 2k CCD with a scale of 0.67″ per pixel.
The Antarctica Search for Transiting ExoPlanets (ASTEP) is a 40 cm telescope installed at the Concordia station on the Antarctic plateau (Dransfield et al. 2022; Mékarnia et al. 2016; Schmider et al. 2022). The FLI ProLine PL16801 4096 × 4096 CCD camera has a field of view of 1° × 1° and a scale of 0.92″ per px.
The Las Cumbres Observatory Global Telescope (LCOGT; Brown et al. 2013) 1.0 m network node is located at the South Africa Astronomical Observatory near Sutherland (SAAO). It is equipped with a 4096 × 4096 SINISTRO camera with an image scale of 0.389″ per pixel, resulting in a 26′ × 26′ field of view.
A transit of TIC 147027702 was observed with OMES during the night of 4–5 April 2025 using a Sloan r′ filter and adopting exposure times of 16 s. The data were processed with an automated dedicated pipeline to deliver the relative photometric light curve of the event. This observation registered an ingress of the transit at the expected time. The light curve we obtained, together with a theoretical one based on the model described in Sect. 4, is shown in Fig. 5.
A transit of TIC 245076932 was monitored with the ASTEP telescope during the night of 4–5 August 2025 using Johnson B and R filters. The adopted exposure time was 60 s in the B and 8 s in the R filter. The complete transit was captured (see Fig. 5).
Two ground-based transits of TIC 87422071 were observed (see Fig. 6). We observed a full transit window on 27–28 May 2021 with the Sloan g′ and Sloan i′ bands from the LCOGT telescope. The images were calibrated using the standard LCOGT BANZAI pipeline (McCully et al. 2018), and differential photometric data were extracted using AstroImageJ (Collins et al. 2017). We used circular ![Mathematical equation: $\[5^{\prime \prime}_\cdot8\]$](/articles/aa/full_html/2026/04/aa58698-25/aa58698-25-eq2.png) photometric apertures that excluded flux from the nearest Gaia DR3 catalogue neighbour, which is bright enough to possibly be the source of the TESS transit detection (Gaia DR3 6721152024675106816). We detected the transit in the target star photometric aperture in both bands, which confirms that the TESS-detected event indeed occurred in TIC 87422071. Another partial transit was captured in the Observatoire Moana during the night of 26–27 March 2024 using a Sloan r′ filter and exposure times of 60 s. The photometric data were processed with the same pipeline as in the case of TIC 147027702.
photometric apertures that excluded flux from the nearest Gaia DR3 catalogue neighbour, which is bright enough to possibly be the source of the TESS transit detection (Gaia DR3 6721152024675106816). We detected the transit in the target star photometric aperture in both bands, which confirms that the TESS-detected event indeed occurred in TIC 87422071. Another partial transit was captured in the Observatoire Moana during the night of 26–27 March 2024 using a Sloan r′ filter and exposure times of 60 s. The photometric data were processed with the same pipeline as in the case of TIC 147027702.
In all three cases, we detected the transit exactly on the target we studied. The shape and time of the observed transit agree with the theoretical model, as is clearly visible in Figs. 5 and 6.
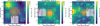 |
Fig. 1 TESS target pixel file of TIC 147027702 (first panel), TIC 245076932 (second panel), and TIC 87422071 (third panel). |
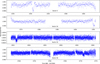 |
Fig. 2 TESS photometry of the four sectors we used in our analysis of TIC 147027702. |
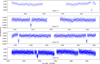 |
Fig. 3 TESS photometry of the four sectors we used in our analysis of TIC 245076932. |
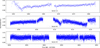 |
Fig. 4 TESS photometry of the three sectors we used in our analysis of TIC 87422071. |
 |
Fig. 5 Ground-based observation of the transits of TIC 147027702 (first panel) and TIC 245076932 in B filter (second panel) and R filter (third panel) with the best model (black). The white points show the binned light curve. |
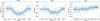 |
Fig. 6 Ground-based observations of the transit of TIC 87422071 with the best model (black). The white points show the binned light curve. From left to right: observation from LCO in g′ filter and i′ filter, and observation from OMES in r′ filter. |
2.3 Spectroscopy
We obtained follow-up radial velocities using the new PLATOSpec spectrograph (Kabáth et al. 2026). PLATOSpec is a white pupil echelle fibre-fed spectrograph with a spectral resolution power of R = 70 000 covering a wavelength range of 380 to 700 nm. PLATOSpec is attached to the ESO 1.52 m telescope at the La Silla Observatory in Chile. Currently, the use of simultaneous calibrations using a thorium-argon (ThAr) lamp in a second fiber allows us to obtain RVs with a precision as good as 6 m/s for bright solar-type stars with slow projected rotational velocities. The PLATOSpec data were processed with a modified version of the ceres pipeline (Brahm et al. 2017a), which performs all the reduction and processing steps required to obtain precision RVs starting from raw science and calibration images. The RV measurements were calculated using cross correlation with a G2-type star template. In addition to precision RVs, the pipeline also delivers other outputs associated with the cross-correlation peak, such as the bisector span (BIS) and full width at half maximum (FWHM) measurements.
We obtained 55 usable spectra of TIC 147027702 between January and July 2025 with a mean RV uncertainty of 26.6 m/s, which was due to the moderate faintness and projected rotational velocity of the star. The observations were performed with exposure times of 20 and 30 minutes, depending on the weather conditions. The average signal-to-noise ratio (S/N) per resolution element of these spectra was 42. A generalized Lomb–Scargle (GLS) periodogram (Fig. 7) of the radial velocities shows a significant peak at ≈44.6 days, which is consistent with the orbital period of the candidate found from the TESS light curves. Additionally, we found no significant correlation between RVs and BIS (see Fig. A.1). The RV measurements do not correlate with values of the FWHM, CCF width or depth, or S/N (the correlation coefficient is lower than 0.05).
We observed TIC 245076932 between February and August 2025 and collected 79 spectra suitable for the following analysis. Observations performed with exposure times of 30 or 40 minutes resulted in a mean S/N of 34 and a mean RV uncertainty of 16.6 m/s. A significant peak at 21.4 days was detected in a GLS RV periodogram (Fig. 7), which agrees well with the orbital period detected by TESS photometry. An additional strong peak is visible at around 10.9 days, which is close to half of the main period. We found no significant correlation between RVs and BIS, FWHM, shape of the CCF, or S/N (the correlation coefficient is lower than 0.1; see the relation for the BIS in Fig. A.1).
For TIC 87422071, we obtained 43 spectra between May and August 2025 using PLATOSpec. An exposure time of 40 minutes was used. The mean value of the RV uncertainty is 23.0 m/s, and the mean S/N is 33. Additionally, 4 spectra obtained by the FEROS spectrograph (Fiber-fed Extended Range Optical Spectrograph; Kaufer et al. 1999) in July 2024 and June 2025 with an exposure time of 20 minutes were used. The FEROS spectrograph covers the range of 360 to 920 nm with a mean resolving power of R = 48 000 and is installed at the ESOMPG 2.2 telescope at La Silla. The mean S/N is 48, and the RV uncertainty is 17.2 m/s. Using the GLS periodogram of the RVs (Fig. 7), we detected a significant peak at 11.5 days, which is very close to the photometric orbital period (11.36 days). A possible weak correlation between the RVs and BIS was observed (Fig. A.1; with a correlation coefficient of 0.4). This correlation is driven by two specific measurements obtained under poor observing conditions.
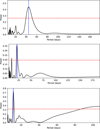 |
Fig. 7 Periodograms of the RV data of TIC 147027702 (top), TIC 245076932 (middle), and TIC 87422071 (bottom). The horizontal red line corresponds to the 1% false-alarm probability, and the blue line marks the orbital period determined from the photometric data. |
3 Stellar parameters
We followed the same iterative procedure as adopted by Brahm et al. (2023) to compute the atmospheric and physical parameters of the host star. We generated a coadded high S/N PLATOSpec spectrum of individual targets. We used the code zaspe (Brahm et al. 2017b) to obtain a first estimate of the atmospheric parameters (Teff, log g, [Fe/H], and v sin i). Then, we performed a spectral energy distribution (SED) fit to publicly available broadband photometry using the PARSEC stellar evolution models (Bressan et al. 2012) and the Gaia DR3 parallax (Gaia Collaboration 2023). In this step, we adopted the metallicity value found in our spectroscopic analysis. The SED fit delivers a more precise value for log g, so we proceeded with a new zaspe run where log g was fixed to the value obtained with the SED fit. We continued to iterate between these two procedures until we reached convergence in the derived atmospheric parameters of two contiguous zaspe runs. To derive realistic uncertainties for the determined parameters, we adopted the procedure described by Tayar et al. (2022) and accordingly inflated the formal uncertainties obtained from our spectral modelling.
According to this modelling, TIC 147027702 is a slightly metal-poor F-type dwarf star ([Fe/H] = −0.08 ± 0.05 dex; Teff = 6410 ± 183 K) with a moderate projected rotational velocity of v sin i = 8.8 ± 0.3, km/s. TIC 245076932 is a late F-type dwarf star (Teff = 6130 ± 178 K) with a rotational velocity of v sin i = 4.2 ± 0.3 km/s close to the end of its life as a main-sequence star (age of about 4.5 Gyr). TIC 87422071 is a slightly metal-rich dwarf star of the F-type ([Fe/H] = 0.16 ± 0.05 dex; Teff = 6150 ± 178 K), very similar to TIC 245076932, but 1 Gyr younger. Its rotational velocity is v sin i = 7.1 ± 0.3 km/s.
Table 1 shows the main stellar parameters of the targets and their identifiers in various catalogues. The sky coordinates (RA, Dec), the proper motion in both directions (μα, μδ), and the parallax π were obtained from Gaia DR3. All listed magnitudes (except for the G magnitude) were collected from the TESS Input Catalog (TIC; Paegert et al. 2021).
4 Analysis and results
We performed a joint analysis of all photometric data (TESS and ground-based transits) and RV measurements. We used the juliet package (Espinoza et al. 2019) based on the packages radvel (RV modelling; Fulton et al. 2018) and batman (transit modelling; Kreidberg 2015).
The following set of planetary orbital parameters was used during the fitting routine as free parameters: the orbital period P, the transit time t0, the impact parameter b ≡ a/R⋆ cos i, the radius ratio p ≡ Rp/R⋆, the eccentricity e and the argument of periastron ω (in the forms e sin ω and e cos ω), the stellar density ρ⋆, and the RV semi-amplitude K.
Each individual dataset is described by instrumental parameters. The relative flux offset μ and the jitter value σ were used in the case of photometric data. We also adopted a quadratic limb-darkening law with coefficients q1 and q2. For RV measurements, we fitted the instrumental systematic RV value μ and the jitter σ.
Moreover, we used Gaussian processes (GP; Ambikasaran et al. 2015) to model stellar activity. We only used this method with TESS data. The GPs are described by two parameters, the amplitude σGP and the timescale ρGP. We used a simple (approximate) Matern kernel implemented in the celerite package (Foreman-Mackey et al. 2017).
Tables 2, 3, and 4 list the priors of all fitted parameters for individual planetary candidates, together with the median values of the posterior distributions. The uncertainties refer to the 1σ credibility interval.
The determined planetary parameters of all three systems are listed in Table 5. We derived additional parameters from the fitted ones. The derived parameters were the orbital inclination i, the semi-major axis a, the planetary mass Mp, the radius Rp, the planet density ρp, the surface gravity gp, the equilibrium temperature Teq, the transit depth δ, and the durations T14 and T23. The equilibrium temperature was estimated under the assumption of zero albedo and perfect heat redistribution (Rodríguez Martínez et al. 2025). The best-fit models for the light curves of individual TESS sectors and phase-folded RV curves for individual systems are shown in Figs. 8, 9, and 10. Figures 5 and 6 show the model of the ground-based light curves.
According to our analysis, TIC 14027702b is a warm Jupiter with a mass of ![Mathematical equation: $\[1.09_{-0.13}^{+0.07}\]$](/articles/aa/full_html/2026/04/aa58698-25/aa58698-25-eq3.png) Mj, a radius of 0.97 ± 0.06 Rj, and an orbital period of 44.4 days. The mean density of the planet is 1.44 g/cm3, and it has a low orbital eccentricity (e =
Mj, a radius of 0.97 ± 0.06 Rj, and an orbital period of 44.4 days. The mean density of the planet is 1.44 g/cm3, and it has a low orbital eccentricity (e = ![Mathematical equation: $\[0.127_{-0.048}^{+0.055}\]$](/articles/aa/full_html/2026/04/aa58698-25/aa58698-25-eq4.png) ). The equilibrium temperature is
). The equilibrium temperature is ![Mathematical equation: $\[863_{-27}^{+26}\]$](/articles/aa/full_html/2026/04/aa58698-25/aa58698-25-eq5.png) K.
K.
The star TIC 245076932 is orbited by a warm-Jupiter-type planet on a significantly eccentric orbit (e = ![Mathematical equation: $\[0.428_{-0.019}^{+0.022}\]$](/articles/aa/full_html/2026/04/aa58698-25/aa58698-25-eq6.png) ) with a period of 21.6 days. The planet has a slightly lower density of 0.75 ± 0.05 g/cm3. Its radius is 0.97 ± 0.05 RJ, and its mass is
) with a period of 21.6 days. The planet has a slightly lower density of 0.75 ± 0.05 g/cm3. Its radius is 0.97 ± 0.05 RJ, and its mass is ![Mathematical equation: $\[0.51_{-0.05}^{+0.04}\]$](/articles/aa/full_html/2026/04/aa58698-25/aa58698-25-eq7.png) MJ. The equilibrium temperature is similar to the previous one, 845 ± 25 K.
MJ. The equilibrium temperature is similar to the previous one, 845 ± 25 K.
The third discovered warm Jupiter orbits star TIC 87422071 with an orbital period of 11.4 days on a low-eccentricity (e = ![Mathematical equation: $\[0.124_{-0.060}^{+0.073}\]$](/articles/aa/full_html/2026/04/aa58698-25/aa58698-25-eq8.png) ) orbit. The radius of the planet is 0.97 ± 0.08 RJ, and its mass is
) orbit. The radius of the planet is 0.97 ± 0.08 RJ, and its mass is ![Mathematical equation: $\[1.29_{-0.11}^{+0.10}\]$](/articles/aa/full_html/2026/04/aa58698-25/aa58698-25-eq9.png) MJ. The mean density is
MJ. The mean density is ![Mathematical equation: $\[1.88_{-0.28}^{+0.33}\]$](/articles/aa/full_html/2026/04/aa58698-25/aa58698-25-eq10.png) g/cm3, and the equilibrium temperature is 1110 ± 33 K.
g/cm3, and the equilibrium temperature is 1110 ± 33 K.
We analysed the interior structure of the three exoplanets. We used the interior structure model “GAS gianT modeL for Interiors” (GASTLI; Acuña et al. 2021, 2025). GASTLI solves the one-dimensional equations of the interior structure for exoplanets under the assumption that the interior is fully convective. The interior is divided into two layers: a heavy-element core composed of a 1:1 rock-water mixture, and an envelope. The envelope consists of water (as a proxy for metals) and H/He at a cosmogonic mass ratio. For each of these materials (H/He, water, and rock), we employed the current equations of state to calculate the density and entropy. Solving the equations of the interior structure of the planet requires defining the pressure and temperature in the outermost computational layer. To this end, we coupled GASTLI to a grid of atmospheric models at a constant pressure of Psurf = 1000 bar, which is high enough for atmospheric models (including the petitCODE grid we used) to solve for radiative transfer, as opacity tables range from low pressures (10−6 bar) to 1000 bar. This grid is the default GASTLI grid computed with the self-consistent 1D atmospheric model petitCODE (Mollière et al. 2015, 2017) for clear atmospheres in chemical equilibrium. petitCODE uses convective adjustment to determine whether an atmospheric layer is convective or radiative, and it self-consistently calculates the Bond albedo to estimate the energy balance at the top of the atmosphere. The GASTLI input parameters are the planetary mass, the core mass fraction (CMF), the atmospheric metallicity log(M/H) (expressed in solar units), the equilibrium temperature at the null Bond albedo Teq(AB = 0), and the internal (or intrinsic) temperature Tint. The internal temperature is defined as the black-body temperature corresponding to the planet emission. As output, GASTLI computes the total planetary radius at the transit pressure in optical photometry (Rplanet; 20 mbar) and the age. The latter was calculated by solving the equation of thermal cooling for a luminosity ![Mathematical equation: $\[L=4 \pi R_{\text {planet}}^{2} T_{\text {int}}^{4}\]$](/articles/aa/full_html/2026/04/aa58698-25/aa58698-25-eq11.png) . In addition, the atmospheric metallicity log(M/H) was converted into the envelope metal mass fraction Zenv by the atmospheric grid via chemical equilibrium. The total bulk metal mass fraction, Zplanet, was estimated to be Zplanet = CMF + (1 − CMF) × Zenv. For more details on the GASTLI interior structure model, see Acuña et al. (2024).
. In addition, the atmospheric metallicity log(M/H) was converted into the envelope metal mass fraction Zenv by the atmospheric grid via chemical equilibrium. The total bulk metal mass fraction, Zplanet, was estimated to be Zplanet = CMF + (1 − CMF) × Zenv. For more details on the GASTLI interior structure model, see Acuña et al. (2024).
We computed a grid for each of the three exoplanets at their respective equilibrium temperatures at the null Bond albedo. The grids spanned their ±5σ mass interval with steps of 0.05MJup. The CMF ranged from 0 to 0.80 in steps of 0.10, log(M/H) ranged from −2 to 2 in steps of 1.0, and Tint ranged from 50 to 350 K in steps of 100 K. We linearly interpolated the grids to obtain the radius and the age for a set of input parameters, which together constitute the forward model in our retrievals. We used the Python package emcee (Foreman-Mackey et al. 2013) to sample the posterior distribution functions. In our retrievals, the mass, CMF, log (M/H), and Tint were free parameters. We adopted a Gaussian prior on the mass, with the mean and standard deviation set to the observed mean and the uncertainty values reported in Table 5. The parameters CMF, log(M/H), and Tint had uniform priors: 𝒰(0, 0.8), 𝒰(−2, 2), and 𝒰(50, 350), respectively. The likelihood function was evaluated from the squared residuals of the mass, radius, and age (Dorn et al. 2015; Acuña et al. 2021).
Table 6 shows the values we retrieved from the compositional parameters for the three exoplanets. We estimated the planet-to-star bulk metal mass fraction ratio by dividing the retrieved Zplanet by the stellar metallicity, Zstar = 0.0152 · 10[Fe/H]⋆ (Tala Pinto et al. 2025). Figure 11 shows the mass-Zplanet/Zstar diagram of the three exoplanets, including the two exoplanet population trends estimated by Thorngren et al. (2016) and Chachan et al. (2025). TIC 245076932 b and TIC 87422071 b are consistent with both trends to 1σ, while TIC 147027702 b is consistent with the fit of Chachan et al. (2025) in 2σ.
Additionally, TIC 245076932 b has a high eccentricity e ~ 0.43. The internal temperature of high-eccentricity exoplanets can be raised above the value predicted by secular cooling due to tidal heating (Leconte et al. 2010; Millholland et al. 2020). Radius inflation becomes significant at Teq > 1000 K, well above the irradiation level of TIC 245076932 b. However, high internal temperatures (Tint ~ 400 K) have been observed in WASP-107 b and V1298 Tau b through disequilibrium chemistry and transmission spectroscopy (Sing et al. 2024; Welbanks et al. 2024; Barat et al. 2025). These two extrasolar gas giants have lower eccentricities than TIC 245076932 b, and it is currently debated whether their additional heating arises from Ohmic dissipation or from super-adiabatic regions induced by magnetic fields and compositional gradients, respectively (Barat et al. 2025; Batygin 2025). Thus, we considered an alternative scenario in which TIC 245076932 b has a high internal temperature Tint = 350 K. This scenario illustrates the effect of the heating mechanisms in inferring the compositional parameters. This scenario leads to a high core mass (Mcore) and Zplanet, as the increase in Tint expands the radius of the planet, requiring a higher metal content to fit the observed mass and radius. In this case, we decoupled Tint from the age by removing the age-squared residuals from the likelihood function in the retrieval.
Core accretion models predict core masses of ~10 M⊕ at least (Pollack et al. 1996). The core masses of all three exoplanets lie above this threshold, which is consistent with an initial core formation stage followed by runaway gas accretion. However, the core mass of TIC 245076932 b might be as low as 4 M⊕ within 1σ. A refinement of the stellar age is required to rule out this low core mass. If this were the case, TIC 245076932 b would not be consistent with the core-accretion paradigm. Additionally, to determine whether these three exoplanets accreted solids during the runaway accretion phase, an atmospheric characterisation is required to estimate their atmospheric metallicities and carbon-to-oxygen ratios, which are valuable diagnostics of pebble and planetesimal accretion (Danti et al. 2023; Feinstein et al. 2025).
For comparison, we also computed the interior composition of the three planets using modules for experiments in astrophysics (MESA; Paxton et al. 2011, 2013). To do this, we closely followed the implementation presented by Jones et al. (2024) and Tala Pinto et al. (2025), but with some minor modifications. In the case of TIC 147027702 b, we adopted the planetary envelope metallicity to be the same as that of the parent star, and we only varied the mass of the inert rocky core, whose density was estimated by assuming a 1:1 mixture of rock and ice (Hubbard & Marley 1989). On the other hand, for TIC 87422071 b, we increased the metallicity of the planet envelope to match its measured radius with our models, while the prescription for modelling the rocky core was identical to that for TIC 147027702 b. The results for these two planets are presented in Table 7. Finally, in the case of TIC 245076932 b, and given its small radius and high irradiation level, we were unable to find a satisfactory model that reproduced its observed properties.
Stellar parameters and identifiers.
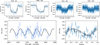 |
Fig. 8 Top: light curves of TIC 147027702 for individual TESS sectors with the best model (black). Bottom: radial velocity time series of TIC 147027702 and phase-folded RV curve with the best model (black). The white points show the binned RV curve. |
Prior parameter distributions and median value of the posterior distributions of the fitted parameters of the joint transit and RV analysis of TIC 147027702.
Prior parameter distributions for TIC 245076932.
Prior parameter distributions for TIC 87422071.
Fitted and derived planetary parameters of all systems.
Interior composition parameters retrieved by our interior structure retrievals.
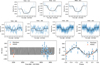 |
Fig. 10 Light curves and RV time series of TIC 87422071. For a detail description, see Fig. 8. The binned RV curve was calculated using PLATOSpec data alone. |
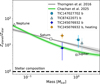 |
Fig. 11 Mass-bulk metal mass fraction diagram for the three exoplanets. We show Neptune, Saturn, and Jupiter (Miguel & Vazan 2023, and references therein) and the exoplanet trends fitted by Thorngren et al. (2016) and Chachan et al. (2025). |
5 Discussion and conclusions
We reported the discovery and characterisation of three warm-Jupiter planets orbiting TIC 14027702, TIC 245076932, and TIC 87422071. These are the first exoplanets detected with the new temperature-stabilised spectrograph PLATOSpec (Kabáth et al. 2026). The source TIC 147027702b is a Jovian planet with a mass of 1.09 MJ and an orbital period of 45 days. With a time-averaged equilibrium temperature below 900 K, it fits the population of warm-Jupiter planets. Planet TIC 245076932b has a significant eccentric orbit (e = 0.43) with an orbital period of 21.6 days. Having a mass of 0.51 MJ and a radius of 0.97 RJ, its bulk density is therefore lower than 800 kg/m3. The third detected planet, TIC 87422071b, has a mass of 1.29 MJ and orbits its parent star in 11.4 days. Due to a smaller distance from a star, its equilibrium temperature is slightly above 1100 K, which is still consistent with the population of warm-Jupiter planets.
Figure 12 shows the population of warm giant exoplanets in a mass-radius diagram. None of the three planets we presented is inflated, and they are close to the bulk density level of 1 g/cm3. These new exoplanets lie in a sparsely populated region of the period-radius diagram (Fig. 13), corresponding to warm-Jupiter planets with orbital periods greater than 10 days. Additionally, TIC 245076932b has a moderately eccentric orbit (see Fig. 14). The other two planets of this study have nearly circular orbits, which are more frequent in the known sample of warm Jupiters.
The population of warm giant planets is also interesting for performing a future atmospheric characterisation (e.g. Bello-Arufe et al. 2025) and for linking the atmospheric composition with possible formation channels. According to our interior structure modelling, the three planets we presented are significantly enriched in heavy elements, and these could translate into high abundances of C-, N-, and O-dominated molecules. We followed Kempton et al. (2018) to calculate the transmission spectroscopy metric (TSM) and the emission spectroscopy metric (ESM). The TSM values of TIC 147027702b, TIC 245076932b, and TIC 87422071b are 7.3 ± 3.3, 35.6 ± 13.7, and 12.8 ± 6.5, respectively. TIC 245076932b appears to be the best candidate for transmission spectroscopy, but is still hardly reachable using JWST/NIRISS (Doyon et al. 2023). However, this planet seems to be a suitable target for future instruments such as ARIEL (Edwards & Tinetti 2022) or ELT/ANDES (Palle et al. 2025). The ESM values are 5.3 ± 0.9 (TIC 147027702b), 13.2 ± 1.6 (TIC 245076932b), and 16.6 ± 3.0 (TIC 87422071b).
A crucial observable for constraining the origin and orbital evolution of warm Jupiters is the inclination of the orbit with respect to the rotation axis of the parent star (stellar obliquity). The projected stellar obliquity can be measured by observing the Rossiter–McLauglin (RM) effect during transit (e.g. Zak et al. 2025b). All three stars in our study are slow rotators. Therefore, the predicted maximum amplitude of the RM effect (i.e. for aligned orbits) is in the range of 18–25 m/s, which would be suitable for instruments like HARPS and ESPRESSO. The significant eccentricity of TIC 245076932b makes it an interesting object for measuring its stellar obliquity because some high-eccentricity migration mechanisms predict significant misalignment (Petrovich & Tremaine 2016). Recent studies targeting moderately eccentric (~0.3–0.6) warm Jupiters (e.g. Espinoza-Retamal et al. 2025; Zak et al. 2025a) showed a tentative trend in the opposite direction, where several mechanisms were proposed to explain the origin of this sub-population of warm Jupiters.
Expanding the sample of well-characterised warm Jupiters, including the three systems presented here, is essential for disentangling the possible theories of warm- and hot-Jupiter planet formation and to place robust constraints on the dominant evolutionary mechanisms at intermediate orbital periods.
Interior composition parameters from MESA.
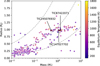 |
Fig. 12 Mass-radius diagram for the population of warm giant planets (P > 10 days). The dashed lines correspond to bulk densities of 0.1 g/cm3, 1 g/cm3, and 10 g/cm3 (from top to bottom). |
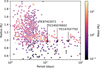 |
Fig. 13 Period–radius diagram for the population of giant planets (M > 0.1 MJ). |
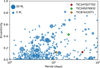 |
Fig. 14 Period-eccentricity diagram for the population of transiting giant planets (M > 0.1 MJ). |
Data availability
Tables with RV measurements are available at the CDS via https://cdsarc.cds.unistra.fr/viz-bin/cat/J/A+A/708/A189.
Acknowledgements
We would like to thank L. Řezba, M. Skarka, and J. Šubjak for performing observations of these targets. This work makes use of observations from the LCOGT network. Part of the LCOGT telescope time was granted by NOIRLab through the Mid-Scale Innovations Program (MSIP). The MSIP is funded by NSF. This research has used the website of the Exoplanet Follow-up Observation Programme (ExoFOP; DOI: 10.26134/ExoFOP5), which is operated by the California Institute of Technology, under contract with the National Aeronautics and Space Administration under the Exoplanet Exploration Programme. Funding for the TESS mission is provided by NASA’s Science Mission Directorate. KAC acknowledges support from the TESS mission via subaward s3449 from MIT. We would like to acknowledge the dedicated staff of the French and Italian polar agencies (IPEV and PNRA) for their dedication and for their work, particularly those who winter-over, which is essential in maintaining the Concordia Station operational throughout the Austral winter, and thanks to whom the ASTEP+ telescope could collect data for this publication. ASTEP+ benefited from the support of the French and Italian polar agencies IPEV and PNRA in the framework of the Concordia station programme, from OCA, INSU, Idex UCAJEDI (ANR-15-IDEX-01) and ESA through the Science Faculty of the European Space Research and Technology Centre (ESTEC). ASTEP+ also received funding through the Science and Technology Facilities Council (STFC; grants no. ST/S00193X/1, ST/W002582/1 and ST/Y001710/1) as well as the European Research Council (ERC) under the Horizon 2020 research and innovation programme of the European Union (grant agreement n° 803193/BEBOP). This work was supported by the Slovak Research and Development Agency under contract No. APVV-24-0160, and by the Ministry of Education, Youth and Sports of the Czech Republic by grant LTT-20015. The research of P.G. was supported by the internal grant No. VVGS-2023-2784 of the P.J. Šafárik University in Košice and funded by the EU NextGenerationEU through the Recovery and Resilience Plan for Slovakia under project No. 09I03-03-V05-00008. Funding for KB was provided by the European Union (ERC AdG SUBSTELLAR, GA 101054354). JJ is grateful that publication could be produced within the institutional support framework for the development of the research organisation of Masaryk University.
References
- Acuña, L., Deleuil, M., Mousis, O., et al. 2021, A&A, 647, A53 [NASA ADS] [CrossRef] [EDP Sciences] [Google Scholar]
- Acuña, L., Kreidberg, L., Zhai, M., & Mollière, P. 2024, A&A, 688, A60 [NASA ADS] [CrossRef] [EDP Sciences] [Google Scholar]
- Acuña, L., Kreidberg, L., Zhai, M., Mollière, P., & Fouesneau, M. 2025, J. Open Source Softw., 10, 7288 [Google Scholar]
- Aller, A., Lillo-Box, J., Jones, D., Miranda, L. F., & Barceló Forteza, S. 2020, A&A, 635, A128 [NASA ADS] [CrossRef] [EDP Sciences] [Google Scholar]
- Ambikasaran, S., Foreman-Mackey, D., Greengard, L., Hogg, D. W., & O’Neil, M. 2015, IEEE Trans. Pattern Anal. Mach. Intell., 38, 252 [Google Scholar]
- Barat, S., Désert, J.-M., Mukherjee, S., et al. 2025, AJ, 170, 165 [Google Scholar]
- Batygin, K. 2025, ApJ, 985, 87 [Google Scholar]
- Bello-Arufe, A., Hu, R., Zilinskas, M., et al. 2025, arXiv e-prints [arXiv:2511.15835] [Google Scholar]
- Brahm, R., Jordán, A., & Espinoza, N. 2017a, PASP, 129, 034002 [Google Scholar]
- Brahm, R., Jordán, A., Hartman, J., & Bakos, G. 2017b, MNRAS, 467, 971 [NASA ADS] [Google Scholar]
- Brahm, R., Espinoza, N., Jordán, A., et al. 2019, AJ, 158, 45 [Google Scholar]
- Brahm, R., Ulmer-Moll, S., Hobson, M. J., et al. 2023, AJ, 165, 227 [NASA ADS] [CrossRef] [Google Scholar]
- Bressan, A., Marigo, P., Girardi, L., et al. 2012, MNRAS, 427, 127 [NASA ADS] [CrossRef] [Google Scholar]
- Brown, T. M., Baliber, N., Bianco, F. B., et al. 2013, PASP, 125, 1031 [Google Scholar]
- Chachan, Y., Fortney, J. J., Ohno, K., Thorngren, D., & Murray-Clay, R. 2025, ApJ, 994, 43 [Google Scholar]
- Collins, K. A., Kielkopf, J. F., Stassun, K. G., & Hessman, F. V. 2017, AJ, 153, 77 [Google Scholar]
- Danti, C., Bitsch, B., & Mah, J. 2023, A&A, 679, L7 [NASA ADS] [CrossRef] [EDP Sciences] [Google Scholar]
- Dong, J., Huang, C. X., Dawson, R. I., et al. 2021, ApJS, 255, 6 [NASA ADS] [CrossRef] [Google Scholar]
- Dorn, C., Khan, A., Heng, K., et al. 2015, A&A, 577, A83 [NASA ADS] [CrossRef] [EDP Sciences] [Google Scholar]
- Doyon, R., Willott, C. J., Hutchings, J. B., et al. 2023, PASP, 135, 098001 [NASA ADS] [CrossRef] [Google Scholar]
- Dransfield, G., Mékarnia, D., Triaud, A. H. M. J., et al. 2022, SPIE Conf. Ser., 12186, 121861F [NASA ADS] [Google Scholar]
- Eberhardt, J., Hobson, M. J., Henning, T., et al. 2023, AJ, 166, 271 [NASA ADS] [CrossRef] [Google Scholar]
- Edwards, B., & Tinetti, G. 2022, AJ, 164, 15 [NASA ADS] [CrossRef] [Google Scholar]
- Espinoza, N., Kossakowski, D., & Brahm, R. 2019, MNRAS, 490, 2262 [Google Scholar]
- Espinoza-Retamal, J. I., Jordán, A., Brahm, R., et al. 2025, AJ, 170, 70 [Google Scholar]
- Feinstein, A. D., Booth, R. A., Bergner, J. B., et al. 2025, arXiv e-prints [arXiv:2506.00669] [Google Scholar]
- Foreman-Mackey, D., Hogg, D. W., Lang, D., & Goodman, J. 2013, PASP, 125, 306 [Google Scholar]
- Foreman-Mackey, D., Agol, E., Ambikasaran, S., & Angus, R. 2017, AJ, 154, 220 [Google Scholar]
- Fulton, B. J., Petigura, E. A., Blunt, S., & Sinukoff, E. 2018, PASP, 130, 044504 [Google Scholar]
- Gaia Collaboration. 2023, A&A, 674, A1 [NASA ADS] [CrossRef] [EDP Sciences] [Google Scholar]
- Hobson, M. J., Trifonov, T., Henning, T., et al. 2023, AJ, 166, 201 [NASA ADS] [CrossRef] [Google Scholar]
- Huang, C. X., Vanderburg, A., Pál, A., et al. 2020, RNAAS, 4, 204 [Google Scholar]
- Hubbard, W. B., & Marley, M. S. 1989, Icarus, 78, 102 [Google Scholar]
- Jones, M. I., Reinarz, Y., Brahm, R., et al. 2024, A&A, 683, A192 [NASA ADS] [CrossRef] [EDP Sciences] [Google Scholar]
- Jordán, A., Brahm, R., Espinoza, N., et al. 2020, AJ, 159, 145 [Google Scholar]
- Kabáth, P., Skarka, M., Hatzes, A., et al. 2026, MNRAS, 545, staf1972 [Google Scholar]
- Kaufer, A., Stahl, O., Tubbesing, S., et al. 1999, The Messenger, 95, 8 [Google Scholar]
- Kempton, E. M.-R., Bean, J. L., Louie, D. R., et al. 2018, PASP, 130, 114401 [CrossRef] [Google Scholar]
- Kley, W., & Nelson, R. P. 2012, ARA&A, 50, 211 [Google Scholar]
- Kreidberg, L. 2015, PASP, 127, 1161 [Google Scholar]
- Leconte, J., Chabrier, G., Baraffe, I., & Levrard, B. 2010, A&A, 516, A64 [NASA ADS] [CrossRef] [EDP Sciences] [Google Scholar]
- McCully, C., Volgenau, N. H., Harbeck, D.-R., et al. 2018, SPIE Conf. Ser., 10707, 107070K [Google Scholar]
- Mékarnia, D., Guillot, T., Rivet, J. P., et al. 2016, MNRAS, 463, 45 [Google Scholar]
- Miguel, Y., & Vazan, A. 2023, Remote Sensing, 15, 681 [NASA ADS] [CrossRef] [Google Scholar]
- Millholland, S., Petigura, E., & Batygin, K. 2020, ApJ, 897, 7 [NASA ADS] [CrossRef] [Google Scholar]
- Mollière, P., van Boekel, R., Dullemond, C., Henning, T., & Mordasini, C. 2015, ApJ, 813, 47 [Google Scholar]
- Mollière, P., van Boekel, R., Bouwman, J., et al. 2017, A&A, 600, A10 [Google Scholar]
- Paegert, M., Stassun, K. G., Collins, K. A., et al. 2021, arXiv e-prints [arXiv:2108.04778] [Google Scholar]
- Palle, E., Biazzo, K., Bolmont, E., et al. 2025, Exp. Astron., 59, 29 [Google Scholar]
- Paxton, B., Bildsten, L., Dotter, A., et al. 2011, ApJS, 192, 3 [Google Scholar]
- Paxton, B., Cantiello, M., Arras, P., et al. 2013, ApJS, 208, 4 [Google Scholar]
- Petrovich, C., & Tremaine, S. 2016, ApJ, 829, 132 [NASA ADS] [CrossRef] [Google Scholar]
- Pollack, J. B., Hubickyj, O., Bodenheimer, P., et al. 1996, Icarus, 124, 62 [NASA ADS] [CrossRef] [Google Scholar]
- Rafikov, R. R. 2005, ApJ, 621, L69 [Google Scholar]
- Ricker, G. R., Winn, J. N., Vanderspek, R., et al. 2015, J. Astron. Telesc. Instrum. Syst., 1, 014003 [Google Scholar]
- Rodríguez Martínez, R., Eastman, J. D., Collins, K. A., et al. 2025, AJ, 169, 72 [Google Scholar]
- Salinas, H., Brahm, R., Olmschenk, G., et al. 2025, MNRAS, 538, 2031 [Google Scholar]
- Santerne, A., Moutou, C., Tsantaki, M., et al. 2016, A&A, 587, A64 [NASA ADS] [CrossRef] [EDP Sciences] [Google Scholar]
- Schlecker, M., Kossakowski, D., Brahm, R., et al. 2020, AJ, 160, 275 [Google Scholar]
- Schlichting, H. E. 2014, ApJ, 795, L15 [Google Scholar]
- Schmider, F.-X., Abe, L., Agabi, A., et al. 2022, SPIE Conf. Ser., 12182, 121822O [NASA ADS] [Google Scholar]
- Sing, D. K., Rustamkulov, Z., Thorngren, D. P., et al. 2024, Nature, 630, 831 [NASA ADS] [CrossRef] [Google Scholar]
- Tala Pinto, M., Jordán, A., Acuña, L., et al. 2025, A&A, 694, A268 [NASA ADS] [CrossRef] [EDP Sciences] [Google Scholar]
- Tayar, J., Claytor, Z. R., Huber, D., & van Saders, J. 2022, ApJ, 927, 31 [NASA ADS] [CrossRef] [Google Scholar]
- Thorngren, D. P., Fortney, J. J., Murray-Clay, R. A., & Lopez, E. D. 2016, ApJ, 831, 64 [NASA ADS] [CrossRef] [Google Scholar]
- Trifonov, T., Brahm, R., Espinoza, N., et al. 2021, AJ, 162, 283 [NASA ADS] [CrossRef] [Google Scholar]
- Walsh, K. J., Morbidelli, A., Raymond, S. N., O’Brien, D. P., & Mandell, A. M. 2011, Nature, 475, 206 [Google Scholar]
- Welbanks, L., Bell, T. J., Beatty, T. G., et al. 2024, Nature, 630, 836 [NASA ADS] [CrossRef] [Google Scholar]
- Wenger, M., Ochsenbein, F., Egret, D., et al. 2000, A&AS, 143, 9 [NASA ADS] [Google Scholar]
- Zak, J., Boffin, H. M. J., Bocchieri, A., et al. 2025a, AJ, 170, 274 [Google Scholar]
- Zak, J., Kabath, P., Boffin, H. M. J., et al. 2025b, A&A, 702, A266 [NASA ADS] [CrossRef] [EDP Sciences] [Google Scholar]
Data from NASA Exoplanet Archive.
Appendix A Activity indices
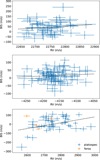 |
Fig. A.1 Bisector span (BIS) as a function of RV of TIC 147027702 (top), TIC 245076932 (middle) and TIC 87422071 (bottom). The dashed line shows the best linear fit to the data. |
Appendix B Corner plots
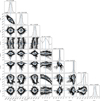 |
Fig. B.1 Corner plot showing posterior distributions and covariances for some fitted parameters in our analysis of TIC 147027702. |
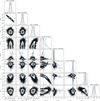 |
Fig. B.2 Corner plot showing posterior distributions and covariances for some fitted parameters in our analysis of TIC 245076932. |
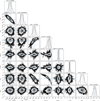 |
Fig. B.3 Corner plot showing posterior distributions and covariances for some fitted parameters in our analysis of TIC 87422071. |
All Tables
Prior parameter distributions and median value of the posterior distributions of the fitted parameters of the joint transit and RV analysis of TIC 147027702.
All Figures
|
Fig. 1 TESS target pixel file of TIC 147027702 (first panel), TIC 245076932 (second panel), and TIC 87422071 (third panel). |
| In the text | |
|
Fig. 2 TESS photometry of the four sectors we used in our analysis of TIC 147027702. |
| In the text | |
|
Fig. 3 TESS photometry of the four sectors we used in our analysis of TIC 245076932. |
| In the text | |
|
Fig. 4 TESS photometry of the three sectors we used in our analysis of TIC 87422071. |
| In the text | |
|
Fig. 5 Ground-based observation of the transits of TIC 147027702 (first panel) and TIC 245076932 in B filter (second panel) and R filter (third panel) with the best model (black). The white points show the binned light curve. |
| In the text | |
|
Fig. 6 Ground-based observations of the transit of TIC 87422071 with the best model (black). The white points show the binned light curve. From left to right: observation from LCO in g′ filter and i′ filter, and observation from OMES in r′ filter. |
| In the text | |
|
Fig. 7 Periodograms of the RV data of TIC 147027702 (top), TIC 245076932 (middle), and TIC 87422071 (bottom). The horizontal red line corresponds to the 1% false-alarm probability, and the blue line marks the orbital period determined from the photometric data. |
| In the text | |
|
Fig. 8 Top: light curves of TIC 147027702 for individual TESS sectors with the best model (black). Bottom: radial velocity time series of TIC 147027702 and phase-folded RV curve with the best model (black). The white points show the binned RV curve. |
| In the text | |
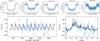 |
Fig. 9 Light curves and RV time series of TIC 245076932. For a detailed description, see Fig. 8. |
| In the text | |
|
Fig. 10 Light curves and RV time series of TIC 87422071. For a detail description, see Fig. 8. The binned RV curve was calculated using PLATOSpec data alone. |
| In the text | |
|
Fig. 11 Mass-bulk metal mass fraction diagram for the three exoplanets. We show Neptune, Saturn, and Jupiter (Miguel & Vazan 2023, and references therein) and the exoplanet trends fitted by Thorngren et al. (2016) and Chachan et al. (2025). |
| In the text | |
|
Fig. 12 Mass-radius diagram for the population of warm giant planets (P > 10 days). The dashed lines correspond to bulk densities of 0.1 g/cm3, 1 g/cm3, and 10 g/cm3 (from top to bottom). |
| In the text | |
|
Fig. 13 Period–radius diagram for the population of giant planets (M > 0.1 MJ). |
| In the text | |
|
Fig. 14 Period-eccentricity diagram for the population of transiting giant planets (M > 0.1 MJ). |
| In the text | |
|
Fig. A.1 Bisector span (BIS) as a function of RV of TIC 147027702 (top), TIC 245076932 (middle) and TIC 87422071 (bottom). The dashed line shows the best linear fit to the data. |
| In the text | |
|
Fig. B.1 Corner plot showing posterior distributions and covariances for some fitted parameters in our analysis of TIC 147027702. |
| In the text | |
|
Fig. B.2 Corner plot showing posterior distributions and covariances for some fitted parameters in our analysis of TIC 245076932. |
| In the text | |
|
Fig. B.3 Corner plot showing posterior distributions and covariances for some fitted parameters in our analysis of TIC 87422071. |
| In the text | |
Current usage metrics show cumulative count of Article Views (full-text article views including HTML views, PDF and ePub downloads, according to the available data) and Abstracts Views on Vision4Press platform.
Data correspond to usage on the plateform after 2015. The current usage metrics is available 48-96 hours after online publication and is updated daily on week days.
Initial download of the metrics may take a while.