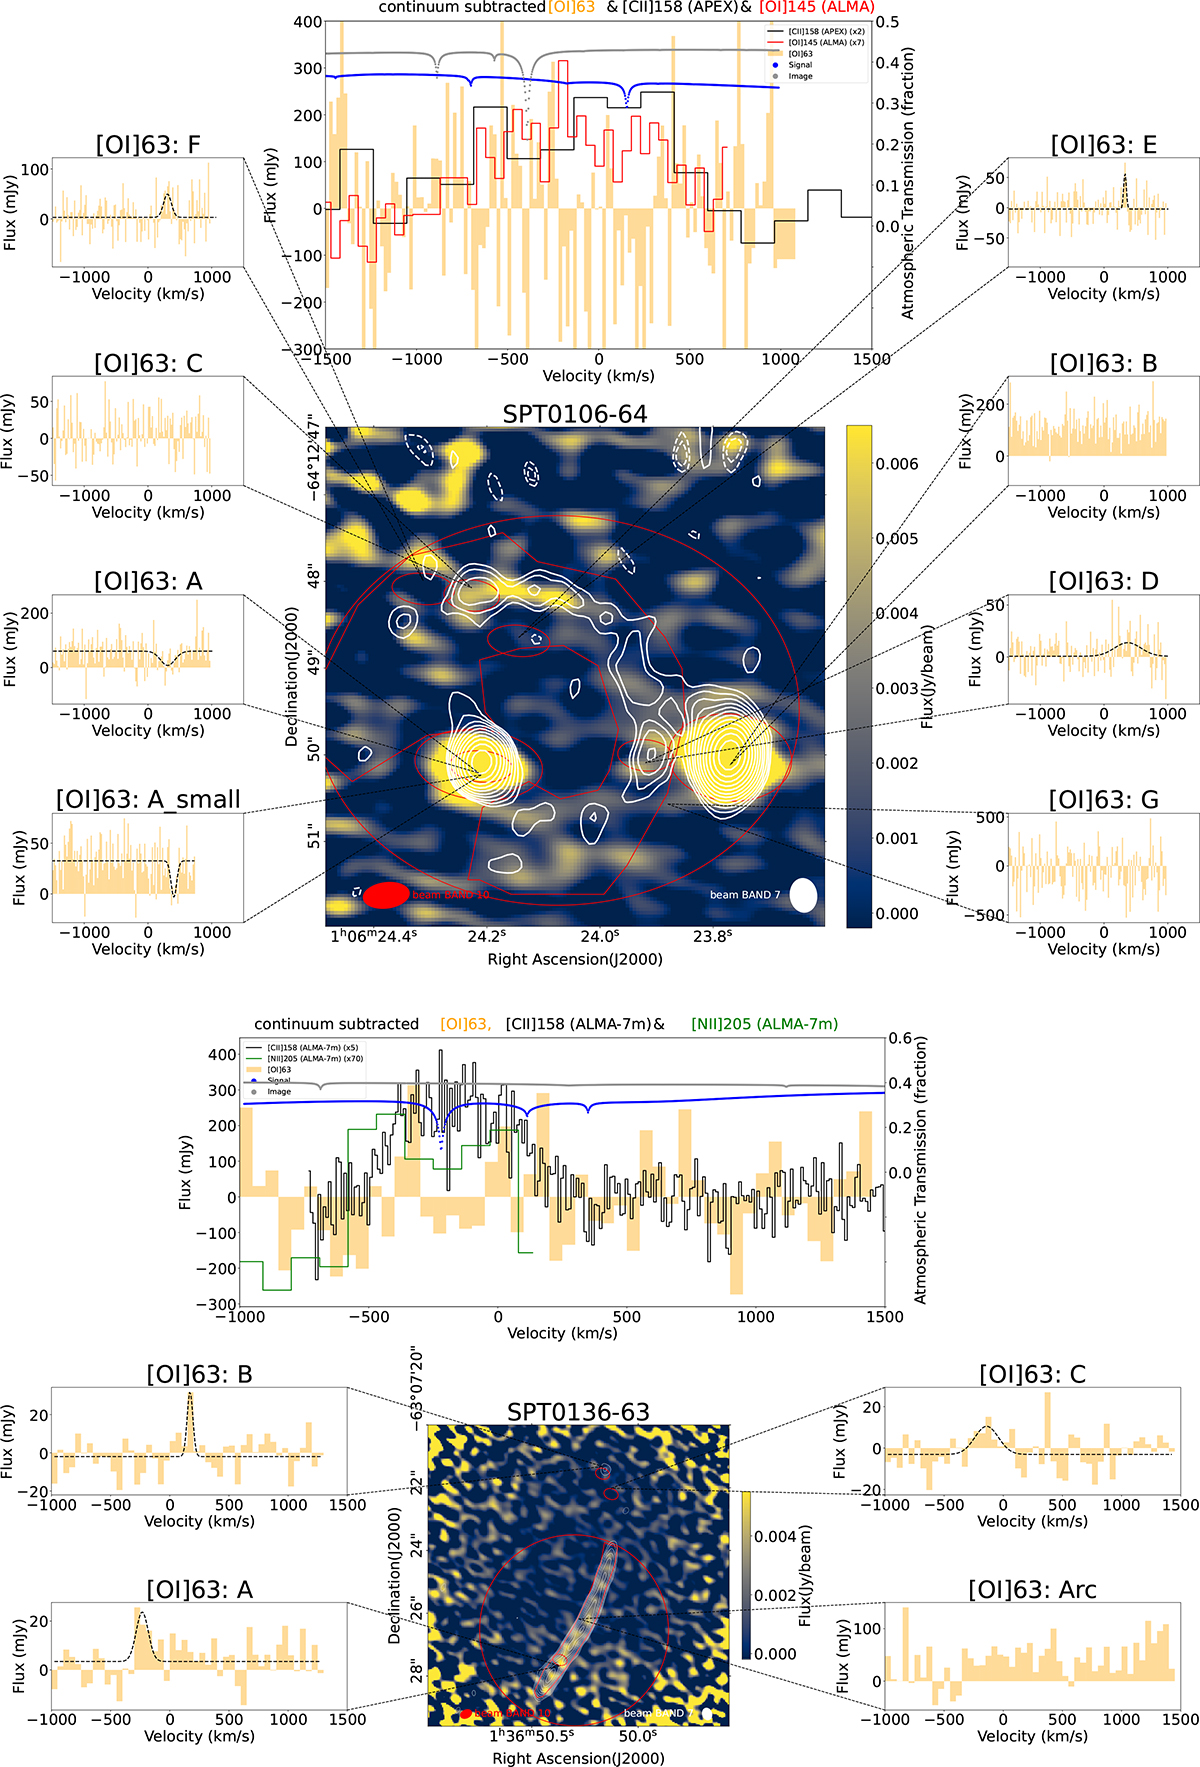
Fig. 1.
Download original image
Overview of the results for SPT0106-64 and SPT0136-63 The central panel shows the Band 10 or 9 line+continuum image (at central frequency listed in Table 1) in colour with the archival Band 7 continuum in white contours for reference. The beam sizes for both images are shown as red and white filled ellipses. The apertures used in Table B.2 are marked in red, and the extracted line+continuum spectra are shown in the left and right side panels. The top panel shows the continuum-subtracted [O I] 63 μm spectrum in yellow with the appropriate atmospheric transmission in both the signal and image band overplotted in blue and grey, respectively. The [C II] 158 μm spectra from APEX or the ALMA 7m-array are overplotted in black, and where available, the [N II] 205 μm spectrum is overplotted in green, with the scaling factors marked in the legend.
Current usage metrics show cumulative count of Article Views (full-text article views including HTML views, PDF and ePub downloads, according to the available data) and Abstracts Views on Vision4Press platform.
Data correspond to usage on the plateform after 2015. The current usage metrics is available 48-96 hours after online publication and is updated daily on week days.
Initial download of the metrics may take a while.