| Issue |
A&A
Volume 708, April 2026
|
|
|---|---|---|
| Article Number | A265 | |
| Number of page(s) | 21 | |
| Section | Extragalactic astronomy | |
| DOI | https://doi.org/10.1051/0004-6361/202558699 | |
| Published online | 13 April 2026 | |
Uncovering the absorbed atomic Universe with the [OI]63 μm line
1
European Southern Observatory, Karl Schwarzschild Straße 2, 85748 Garching, Germany
2
Joint ALMA Observatory, Alonso de Córdova 3107, Vitacura, Casilla 19001, Santiago de Chile, Chile
3
National Astronomical Observatory of Japan, Los Abedules 3085 Oficina 701 Vitacura 763 0414, Santiago, Chile
4
European Southern Observatory, Alonso de Córdova 3107, Vitacura, Casilla 19001, Santiago de Chile, Chile
5
Instituto de Estudios Astrofísicos, Facultad de Ingeniería y 455 Ciencias, Universidad Diego Portales, Av. Ejército Libertador 441 Santiago, Chile
6
Sterrenkundig Observatorium, Ghent University, Krijgslaan 281–S9, B-9000 Gent, Belgium
7
Max Planck Institute für Astrophysik, Karl-Schwarzschild-Strasse 1, 85748 Garching, Germany
8
Cornell Center for Astrophysics and Planetary Sciences, Cornell University, Ithaca, NY 14853, USA
9
Aix Marseille Univ, CNRS, CNES, LAM, Marseille, France
★ Corresponding author: This email address is being protected from spambots. You need JavaScript enabled to view it.
Received:
19
December
2025
Accepted:
24
February
2026
Abstract
We report the discovery of strongly absorbed [O I] 63 μm in a sample of 12 dusty star-forming galaxies (DSFGs) at 4.2 < z < 5.8. This is the first systematic survey of the [O I] 63 μm fine-structure line at z > 4, targeting a sub-sample of gravitationally lensed DSFGs selected from the South Pole Telescope survey. Using ALMA Bands 9 and 10, we obtained spatially and spectrally resolved observations that probe the interstellar medium on sub-kiloparsec scales. Despite reaching sensitivities one to two orders of magnitude deeper than most previous studies, we detect [O I] 63 μm in emission in only two sources at low significance, with the remaining galaxies yielding stringent non-detections over the full velocity range covered by robust detections of other far-infrared lines, including [C II] 158 μm and [N II] 205 μm. We identify several compact (0.05–0.2″) regions with [O I] 63 μm absorption against the far-infrared dust continuum, some of which are possibly reaching below rest-frame cosmic-microwave-background (CMB) radiation level. This suggests the presence of low-excitation-temperature (Tex ≤ TCMB(z)), low-density gas along those lines of sight. We also detect narrow, spatially localised [O I] 63 μm emission ’escape channels’ preferentially detected in regions with weak or absent dust continuum emission. We also predict that similar absorption effects may appear in the [C II] 158 μm line, particularly when concentrating on the regions with the densest foreground material along the line of sight. The [O I] 63 μm line appears to be strongly affected by the influence of extended star forming regions, with a mix of compact, high-optical-depth [O I] 63 μm -emitting regions and sub-thermally excited, oxygen-rich molecular clouds dispersed throughout high-redshift starbursts that are capable of absorbing the ground-state line emission. Combined with a comparison to cosmological radiation hydrodynamical simulations, this supports the interpretation that regions with higher gas and dust column densities may lead to weakening an intrinsically strong [O I] 63 μm line emission. We argue that the high [O I] 63 μm optical depth is the dominant effect causing the strong absorption, limiting the diagnostic power of this line to trace regions of massive star formation in high-redshift DSFGs.
Key words: ISM: atoms / dust, extinction / ISM: lines and bands / galaxies: ISM / galaxies: star formation
© The Authors 2026
 Open Access article, published by EDP Sciences, under the terms of the Creative Commons Attribution License (https://creativecommons.org/licenses/by/4.0), which permits unrestricted use, distribution, and reproduction in any medium, provided the original work is properly cited.
This article is published in open access under the Subscribe to Open model. This email address is being protected from spambots. You need JavaScript enabled to view it. to support open access publication.
1. Introduction
Far-infrared (FIR) fine-structure lines (FSLs) are among the major coolants of the interstellar medium (ISM), typically emitting at a few percent of the total infrared luminosity in galaxies (e.g. Crawford et al. 1985; Stacey et al. 1991; Fischer et al. 1999; Madden et al. 2013; Cormier et al. 2015; Wolfire et al. 2022). These lines are also excellent tracers of the physical conditions in the various phases of the ISM (Abel et al. 2005; Nagao et al. 2011; Decarli & Díaz-Santos 2025; Peng et al. 2025c). The [C II] 158 μm line is one of the primary coolants and is not significantly affected by dust attenuation due to its relatively long wavelength. For almost four decades, it has been a workhorse for near and far extragalactic studies and used as a tracer of star formation activity (e.g. Brauher et al. 2008; Stacey et al. 2010; De Looze et al. 2014; Capak et al. 2015). Due to its low-excitation potential (91 K above ground), the [C II] line has also routinely been used to trace extended gas in galaxy haloes (e.g. Herrera-Camus et al. 2021; Lambert et al. 2023) and to the cold gas reservoir of galaxies (Zanella et al. 2018; Madden et al. 2020). Other FSLs such as [O III] 88 μm and 52 μm and [N II] 205 μm and 122 μm trace the H II regions, while [C II] originates from both the neutral- and ionised-gas phases, given that the ionisation potential of carbon (11.26 eV) is lower than that of hydrogen (13.6 eV). On the other hand, the [O I] emission is thought to primarily originate from dense photo-dissociation regions (PDR; Tielens & Hollenbach 1985; Malhotra et al. 2001), which are frequently used in the local Universe to constrain the radiation field intensity (G0) in combination with the [C II] line and total infrared (TIR) dust continuum emission.
The [O I] 63 μm and 145 μm lines probe the ISM in the high-density regime due to the high critical densities for collisions with H atoms of 4.7 or 7.8 × 105 cm−3 for the [O I] 63 μm line and 0.95 or 2.0 × 105 cm−3 for the [O I] 145 μm line, reporting the values by Fernández-Ontiveros et al. (2016) and Goldsmith (2019), respectively. Because the [O I] 63 μm line emission is due to the ground-state transition (3P1 → 3P2) of neutral oxygen with a high Einstein A coefficient, and the neutral gas is often arranged in dense clouds that have a high column density, the [O I] 63 μm line is often optically thick (i.e. not all photons are able to escape from the cloud) and prone to self-absorption effects (due to the absorption of 63 μm photons by material along the line of sight). The [O I] 145 μm line transition (3P0 → 3P1) has a de-excitation coefficient that is ∼50× smaller than the 63 μm line (Lique et al. 2018), and is hence optically thin in almost all astrophysical environments (e.g. Goldsmith 2019). As a result, the ratio of both lines, i.e. [O I] 63 μm/[O I] 145 μm, is often affected by the optical depth due to self-absorption effects; only in cases where the 63 μm line is optically thin can the line ratio be used to determine the gas density in the high-density regime. Galaxy zoom-in simulations also predict the [O I] 63 μm and 145 μm lines to play an increasingly important role as cooling lines in the neutral gas and should be readily detectable in high-redshift galaxies (Pallottini et al. 2022). Being prone to optical depth and self-absorption effects, it is reasonable to consider that the apparent [O I] 63 μm line emission could be significantly diminished compared to theoretical expectations in some of the most compact dusty high-z galaxies.
The [O I] 145 μm line has been routinely detected in local galaxy samples, ranging from low-metallicity dwarfs (Cormier et al. 2015) over normal star-forming galaxies (Herrera-Camus et al. 2018) to starbursts (Farrah et al. 2013) and Active Galactic Nucleus (AGN)-dominated galaxies (Spinoglio et al. 2015; Fernández-Ontiveros et al. 2016). In recent years, the [O I] 145 μm has also been detected in some high-redshift quasars and starbursts (De Breuck et al. 2019; Yang et al. 2019; Lee et al. 2021; Meyer et al. 2022; Litke et al. 2023; Fudamoto et al. 2025). The detections of the [O I] 63 μm line have remained limited mostly to z ∼ 2 galaxies detected with Herschel (Coppin et al. 2012; Brisbin et al. 2015; Wardlow et al. 2017; Zhang et al. 2018; Wagg et al. 2020). Despite having had the capability to observe [O I] 63 μm at z > 4 since 2012, the first ALMA detections were only recently reported in J2054-0004 at z = 6.040 (Ishii et al. 2025) and W2246-0526 at z = 4.601 (Fernández Aranda et al. 2024). In the latter source, the [O I] 63 μm line luminosity rivals that of the [C II] line emission; however, an earlier bright [O I] 63 μm detection (Rybak et al. 2020b) was later refuted (Rybak et al. 2023), showing that the undetected [O I] 63 μm line was consistent with being at least five times fainter than [C II]. Also in SPT0346−52 at z = 5.7, the [O I] 63 μm was not detected1 with a luminosity < 0.6× that of [C II] 158 μm (Litke et al. 2022). However, we must consider two biases potentially affecting the current picture in the literature; first, publication bias leads to non-detections being under-represented in papers, and second, the [O I] 63 μm line can only be observed in the high-frequency bands 9 or 10 at 4 < z < 6.88, which were perceived to be more difficult and hence under-utilised compared to the lower frequency Bands 6, 7, and 8, where the [C II] 158 μm and [O I] 145 μm lines are observable at z > 2.8 and z > 3.1, respectively. The view of [O I] 63 μm at high-z is still highly incomplete, and to date it appears to differ from our knowledge in the local Universe. Clearly, a complete and statistical sample of [O I] 63 μm observations at z > 4 is required to determine the origin of this difference with low-redshift samples.
In this paper, we report the results from the first survey of [O I] 63 μm at z > 4 from gravitationally lensed, dusty star-forming galaxies (DSFGs) selected from the South Pole Telescope (SPT; Reuter et al. 2020). This sample is unique in both the ten-band photometric coverage of the dust spectral energy distribution (SED) from 3 mm to 70 μm, its complete redshift coverage, and rich ancillary data covering many FSLs such as [C I] (Bothwell et al. 2017), [C II] 158 μm (Gullberg et al. 2015), and [N II] 205 μm (Cunningham et al. 2020), as well as multiple CO transitions (Weiß et al. 2013; Strandet et al. 2016; Aravena et al. 2016; Reuter et al. 2020). From this sample, we selected all 20 targets where the [O I] 63 μm line falls within the atmospheric windows accessible to ALMA.
This paper is structured as follows. In Sect. 2, we describe both the [O I] 63 μm and archival observations. Section 3 presents our results, which are discussed in Sect. 4. Section 5 contains our conclusions and summary. Throughout this work, we adopted the following cosmology: H0 = 67.8 km s−1 Mpc−1, Ωm = 0.308, and ΩΛ = 0.692 (Planck Collaboration XIII 2016).
2. Observations
2.1. Band 10 and 9 [O I] observations
The observations were conducted between 2024 October and 2025 April as part of project ID 2024.1.01465.S (PI: Harrington). We present data using the ALMA Band-10 receiver (Uzawa et al. 2013) of ten sources at 4 < z < 5 and the Band-9 receiver (Baryshev et al. 2015) of two sources at 5.6 < z < 6.9. As part of the project, Band-10 data were also taken of two additional unlensed sources from our sample and are reported elsewhere (Harrington et al. 2025, Vishwas et al, in prep.); two DSFGs (SPT0552-42 and SPT0544-40) were missed within the ∼13″ALMA primary beam due to the large positional uncertainty of the known SPT coordinates. Four sources in our project sample were not observed due to scheduling constraints or the absence of suitable calibrators. The sample of 12 lensed DSFGs presented here therefore represents an unbiased sub-sample.
Most observations were taken in configurations C43-2 and C43-3, with maximum baselines up to 500 m, but the April data were taken in C43-5 with maximum baselines up to 1400 m. Given that the typical spatial extent of the targets is ∼1–2″, they are smaller than the maximum recoverable size (MRS), except for SPT2146-55, where some emission may have been resolved out (θMRS ∼ 0 8).
8).
The Band-9 and -10 ALMA receivers are double-sideband (DSB) receivers, and thus while configuring the spectral windows with a maximum bandwidth of 1.875 GHz in each signal sideband, the 90 ° Walsh switching correlator mode can be enabled to recover the corresponding image sideband (enabling additional spectral coverage on the opposite side of the local oscillator frequency2). Our defined spectral setup consisted of four contiguous spectral windows of 1.875 GHz bandwidth each, defined in the signal sideband using frequency-division mode (FDM), providing 7.5 GHz bandwidth per sideband and a total of 15 GHz bandwidth when the signal and image sidebands are combined for imaging. We chose the tuning of the spectral windows to minimise the impact of telluric absorption features in both the signal and image bands of the observing setup, as illustrated by the blue and grey curves in the top panels of Figs. 1 to 6. Despite the large bandwidth, calibration is often difficult for high-frequency data, and the band-to-band calibration scheme was employed by the observatory for most observations; see Sect. 2.2 for further details.
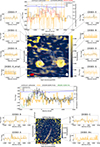 |
Fig. 1. Overview of the results for SPT0106-64 and SPT0136-63 The central panel shows the Band 10 or 9 line+continuum image (at central frequency listed in Table 1) in colour with the archival Band 7 continuum in white contours for reference. The beam sizes for both images are shown as red and white filled ellipses. The apertures used in Table B.2 are marked in red, and the extracted line+continuum spectra are shown in the left and right side panels. The top panel shows the continuum-subtracted [O I] 63 μm spectrum in yellow with the appropriate atmospheric transmission in both the signal and image band overplotted in blue and grey, respectively. The [C II] 158 μm spectra from APEX or the ALMA 7m-array are overplotted in black, and where available, the [N II] 205 μm spectrum is overplotted in green, with the scaling factors marked in the legend. |
We obtained calibrated measurement sets provided by the ALMA pipeline, which was found to be reliable the for high-frequency data, including those using band-to-band calibration (included since the 2024 pipeline version3). In a few cases, manual data reduction was provided by the European ALMA Regional Center due to lower signal-to-noise datasets requiring specific treatment to carefully flag data. Line emission is expected to span several spectral windows, so we could not use pipeline imaging products, which are produced on a per-spectral-window basis. We therefore used the tclean task in CASA (Bean 2022) with all spectral windows and an auto-multi-thresh (Kepley et al. 2020) cut-off. We used a range of spectral bin widths ranging from the native spectral resolution of a few km s−1 to 10, 20, 50, and 110 km s−1. In the remainder of this paper, we use the 20 or 50 km s−1 data, which was an optimal compromise between Signal to noise (S/N) and spectral resolution for narrow lines. To image the spectral line data, we used the robust=0.5 parameter, while for the continuum images, we maximised the S/N using robust=2.
2.2. High-frequency considerations
One of the most important considerations for high-frequency observations is that the phase rms is sufficiently low (stable atmosphere) so as to minimise the loss of flux due to decoherence during phase correction, while another is that close enough and bright enough phase calibrators are used for phase referencing. All but two sources were observed using the band-to-band calibration technique that observes a phase calibrator at a lower frequency than the high-frequency tuning required for the science target. This method scales the high signal-to-noise solutions from the phase calibrator to the target source observed in the high-frequency band during phase transfer, while also using a differential gain calibrator to align the band-to-band offset (e.g. Asaki et al. 2020b,a, 2023; Maud et al. 2020, 2022, 2023a). The technique allows phase transfer using nearby phase calibrators for observations that would have calibrators that are too distant or too faint for in-band calibration.
Table 1 lists the conditions and parameters of the observations. As can be calculated by inputting the phase rms into Eq. (1) of Maud et al. (2022), under the assumption of point-source detection, the visibility coherence can be used to estimate the final image coherence. The phase rms is established using the high-frequency data of the bandpass calibrator by selecting time samples equivalent to the phase-referencing cycle-time4, thus acting as a proxy for the phase rms likely remaining in the science target(s) after phase referencing; see Maud et al. (2022, 2023b) and Section 3.14.3 of Hunter et al. (2023) for additional details. For our data, although most fields are (sometimes marginally) resolved, this still provides a useful estimate of decoherence. Of our sources, SPT2132-58 has the worst phase rms of 47°, which relates to a visibility coherence of ∼0.71; i.e. approximately 29% of the flux is not well ‘focused’ in the target location within the image. All other observations have a notably smaller phase rms, and thus a flux loss of ∼10–15% can typically be expected. When considering image degradation caused by high separation angles to the phase calibrator, previous high-frequency studies focussed on longer baseline observations (Maud et al. 2020, 2023a). These authors find that the degradation worsens with larger separation angles as a function of increasing frequency and longer baseline lengths. Despite investigations at Band 10 for short baselines lacking, it should be reasonable to adopt a coherence degradation of −0.022 per degree separation to the phase calibrator as stated for ‘short’ baselines under 5000kλ. As our observations typically have calibrators of < 4°, a general degradation of < 9% can be expected. For SPT2311-54, the phase-calibrator separation angle to the target is ∼7° as this was a ‘shared’ observation with another source where one common phase calibrator was used. In this case, SPT2311-54 could have an additional degradation of ∼15%. Considering most of our observations used band-to-band calibration, the investigations by Maud et al. (2020) also stated that there could be a degradation due to an underlying phase rms residual of the differential gain calibrator after frequency-scaled phase correction. For a residual phase rms of < 20° (in the differential gain calibrator phases) the degradation amounts to < 5%. This is reasonable for our observations given the low- to high-frequency scans on the differential gain calibrator have a faster cycle time than the phase calibrator to the target, for which the estimated phase rms values indicated in Table 1 are already low. Finally, we note that absolute astrometric accuracy also depends on the phase transfer and to some extent the de-coherence. Typically, we do not expect the absolute position uncertainties to exceed 10–20% of θsynth ; see Section 10.5.2 of the ALMA Technical Handbook Cortes et al. (2025).
ALMA Band-9 and -10 observations.
In summary, a combined flux loss of up to 10–30% can be expected due to phase calibration, which is similar to the absolute flux calibration accuracy of ∼20%. Appendix B compares our Band-9 and -10 data with published Herschel data, yielding consistent photometry in half of our sources, whereas the lower ALMA fluxes in the other half may be due to the inclusion of companion sources in the much larger Herschel beam.
2.3. Supporting archival data
Seven of the 12 sources with [O I] 63 μm data already have published [C II] 158 μm data from the Atacama Pathfinder Experiment (APEX; Gullberg et al. 2015). The remaining five sources were observed between 2021 October and November with the ALMA 7m array (ID 2021.1.00857.S, PI: De Breuck) using Band 7 (Mahieu et al. 2012). Each source was observed for 33 minutes using a tuning covering the [C II] 158 μm line. The data were reduced by the ALMA pipeline and re-imaged as described in Section 2.1. The synthesized beam of the 7m array at these frequencies is 2 1–2
1–2 6, meaning that all our sources are unresolved, providing a total line flux similar to the APEX spectra.
Nine of the sources also have [N II] 205 μm data observed with the ALMA 7m array (Cunningham et al. 2020). For consistency, we obtained calibrated measurement sets from the Additional Representative Images for Legacy (ARI-L; Massardi et al. 2021), re-imaged these data using the same procedures as in Section 2.1, and list the newly derived flux densities in Table B.2. To compare the continuum morphology, we downloaded archival Band-7 data, part of which were previously published by Spilker et al. (2016).
3. Results
3.1. Continuum results
The central panels of Figs. 1 to 6 show the rest-frame 63 μm continuum emission5 with archival observer-frame 870 μm continuum emission overlaid as white contours. As the synthesized beam sizes are very similar, these overlays allow a direct comparison, showing very consistent overall morphologies between both bands and providing confidence in the quality of the high-frequency data. Looking into the finer details, we do notice some variations in the locations of the dust peaks (e.g. SPT0418-47). However, as the Band-10 data cover ∼3× higher frequencies, where the dust emission may become optically thick, a detailed radiative transfer treatment is required; we defer such an investigation to a future publication.
3.2. [O I] results
The top panels of Figs. 1 to 6 show the integrated [O I] 63 μm spectra as yellow histograms, with the integrated [C II] 158 μm and [N II] 205 μm (where available) spectra overplotted to indicate the expected velocity extent of the emission. Four sources also have [O I] 145 μm spectra, which will be reported in a companion paper (Hermans et al., in prep.). The apertures used (listed in Col. 5 of Table B.2) are based on the total extent of the Band-7 and -10 continuum data, which are mostly defined by the Einstein ring morphology. Note that the we could not use the ∼11″ APEX beam size as this would have extended beyond the Band-10 primary beam. Our fluxes or upper limits could therefore be considered conservative.
In these integrated spectra, we find only tentative [O I] 63 μm detections in two sources (SPT0459-58 and SPT2132-58), with the remaining ten sources being clear non-detections. This generalises the previously reported trend of non-detections (Litke et al. 2022; Rybak et al. 2023), but contrasts with the strong detection of Fernández Aranda et al. (2024). To determine reliable upper limits on our [O I] 63 μm fluxes, we estimated the rms noise by creating moment-zero maps of each source integrated over the [C II] 158 μm velocity ranges. Within the full source aperture (see Table B.2), we randomly placed 1000 beam-sized apertures and measured the flux from the moment-zero map in each. The resulting flux distribution was fitted with a one-dimensional Gaussian, and the standard deviation of this fit was adopted as the rms noise level. Table B.2 lists our derived line fluxes and upper limits, together with the [C II] 158 μm and [N II] 205 μm fluxes with the apertures used.
To benefit from the available high spatial and spectral resolution, we also extracted [O I] 63 μm spectra in apertures of particular interest, as described per source in Appendix C. The side panels of Figs. 1 to 6 show these component extractions labelled alphabetically, with their positions, sizes, and fluxes listed in Table B.2. The general trends can be summarised as follows:
-
Continuum components are reliably detected, but no [O I] 63 μm emission is detected at these locations.
-
Narrow-velocity [O I] 63 μm emission is detected only in positions where there is no continuum emission (e.g. SPT0136-63 B, SPT0155-62 B, SPT0418-47 D, SPT0441-46 D, SPT0459-59 A, SPT2146-55 A, and SPT2351-57 A).
-
Several of the brightest continuum components instead show [O I] 63 μm in absorption (SPT0106-64 A, SPT0459-58 A, SPT0459-59 B, SPT2351-57 B; see Fig. 7).
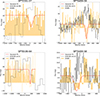 |
Fig. 7. Zoomed-in view of [O I] 63 μm spectra of the four targets showing tentative absorption against the continuum with integrated [C II] 158 μm lines overlaid as black lines. See Figs. 1 to 6 for the full spectra. |
Overall, our observations indicate that the [O I] 63 μm emission is strongly suppressed and can only escape the galaxies through narrow velocity and spatial channels. In the following, we refer to these as ‘escape channels’.
4. Discussion
Our spatially resolved [O I] 63 μm survey quadruples the number of such reported observations in z > 1 galaxies, compared to the two previous detections (Fernández Aranda et al. 2024; Ishii et al. 2025) and two non-detections (Litke et al. 2022; Rybak et al. 2023). It also follows the trend of low [O I] 63 μm detection rates reported from Herschel observations of z > 1 galaxies (e.g. Sturm et al. 2010; Coppin et al. 2012; Brisbin et al. 2015; Wardlow et al. 2017; Zhang et al. 2018; Wagg et al. 2020), but contrasts with the fact that [O I] 63 μm has been observed to be among the top three most luminous FSLs in nearby galaxies (e.g. Brauher et al. 2008; Madden et al. 2013; Cormier et al. 2015; Fernández-Ontiveros et al. 2016). Our new results show that the low spatial and/or spectral resolution of Herschel and APEX leads to the faint integrated [O I] 63 μm fluxes in those observations, as the galaxy-integrated measurements average over both absorbed and unabsorbed regions. Similarly, stacking galaxy-integrated spectra may lead to a detection when adding up a sufficient number of escape channels in these sources. However, our results show that high-spatial-resolution measurements are required to avoid galaxy-wide measurements that are biased towards the intrinsically small emitting regions. We now place our [O I] 63 μm survey results in context.
4.1. Line-ratio plots
First and foremost, it is important to verify that our [O I] 63 μm observations reached a sufficient depth to draw meaningful conclusions from our mostly non-detections. Figure 9 adds our 12 data points to the compendium of both low-z and high-z galaxies of Peng et al. (2025b). We find that our [O I] 63 μm non-detections are 1–2 orders of magnitude deeper than previous detections. The [O I] 63 μm emission in our z > 4 DSFGs is therefore either intrinsically less luminous or the emission is strongly absorbed. In the former interpretation, we could expect to find similar trends in some of the other lines, but the [C II] 158 μm and even the [N II] 205 μm (which traces HII regions rather than PDRs) are fully consistent with the other samples (Fig. 11). Furthermore, the [O I] 145 μm line is observed to be sometimes more than a magnitude more luminous than [O I] 63 μm in SPT0418-47 (De Breuck et al. 2019) and three other sources from our sample (Hermans et al., in prep.), while most models predict this line to be ∼10× fainter (e.g. Goldsmith 2019; Parente et al. 2026). As the observed extreme [O I] line ratios would require an unphysical interpretation, we therefore conclude that the [O I] 63 μm must be strongly absorbed. Any studies interpreting the ratio of [O I] 63 μm with other line or FIR luminosity therefore need to carefully take this absorption into account.
Two conclusions can be drawn from the L[OI]63/LFIR versus LFIR plot (Fig. 9). First, the two previously detected [O I] 63 μm lines are in AGN-dominated sources: W2246-0526 (Fernández Aranda et al. 2024) and J2054-0005 (Ishii et al. 2025). While the statistics are still low, this suggests either an enhanced [O I] 63 μm emission (e.g. Abel et al. 2009; Richings et al. 2021) or a reduced absorption in AGN-dominated sources, possibly as a result of higher global temperatures and less cold, low-excitation [O I] 63 μm absorbing material. Second, the L[OI]63/LFIR values below 10−4 observed in the SPT DSFGs are rarely seen in lower redshift galaxies. One caveat is that many of the Herschel observations at 1 < z < 3 are non-detections, and they could have similar ratios if observed down to similar depths to our ALMA data. The observed trend may thus still be with FIR luminosity rather than with redshift. Sensitive ALMA [O I] 63 μm observations of less luminous FIR sources at z 4 are required to elucidate this.
4.2. The nature of the strong [O I] 63 μm absorbers
4.2.1. Comparison with Galactic and lower redshift results
Absorption features in the [O I] 63 μm line and against the dust continuum were already reported in the first spectrally resolved [O I] 63 μm observations targeting the DR21 star-forming region (Poglitsch et al. 1996) and the main core of the Sgr B2 complex (Baluteau et al. 1997; Vastel et al. 2002). This can be explained by a high column density of atomic oxygen of this optically thick line, creating absorption by O0 either within the emitting cloud itself or by foreground clouds within the ISM along the line of sight. Already for column densities of NH ≳ 1022 cm−2, which are quite common in the neutral medium, the [O I] 63 μm line becomes optically thick for line widths of 10 km s−1 (Decarli & Díaz-Santos 2025). In contrast, the [O I] 145 μm line will almost always be optically thin, but the [C II] 158 μm line could also become optically thick at NH≳ 4 × 1022 cm−2 and has shown similar, though shallower, absorption profiles (e.g. Guevara et al. 2020).
Spatially and spectrally resolved data can distinguish between the origin of the absorption within the emitting or foreground cloud, as the latter will often have an offset in velocity. Such observations have been difficult as 63 μm observations can only be done with relatively small space telescopes such as the Infrared Space Observatory and Herschel, or airborne telescopes, such as the Kuiper Airborne Observatory and the Stratospheric Observatory For Infrared Astronomy (SOFIA). Only in several nearby Galactic star-forming regions have such resolved observations been possible (e.g. Kraemer et al. 1998; Leurini et al. 2015; Gerin et al. 2015; Gusdorf et al. 2017; Schneider et al. 2018; Mookerjea et al. 2019; Goldsmith et al. 2021; Jackson et al. 2024). These studies favoured the interpretation that the [O I] 63 μm absorption originates predominantly in foreground clouds within the ISM, as many regions show clear absorption profiles not only against the emission profile, but also against the background continuum. From a comparison of the [O I] 63 μm, 13CO, and HI absorption profiles, Lis et al. (2001) demonstrated that, although regions are expected to be primarily molecular, the O0 abundance is non-negligible, with a linear relationship suggesting a correlation with CO gas column density and a gas-phase abundance of neutral oxygen that is about 10% of CO. The regions with strong [OI] line emission are found to have a reduction of a factor of ∼3 in the spectro-spatially integrated [OI]63 intensity, as geometric effects (such as HII regions and incidental UV flux density existing behind lines of sight to cold foreground clouds) influence the observed emission (Goldsmith et al. 2021). Thanks to the improved spectral resolution of SOFIA, these absorbers can be studied in multiple tracers such as the optically thin 13[C II] and [O I] 145 μm, showing that the absorbing O0 is co-spatial with C+ in a dense, low-excitation foreground cloud associated with the PDR (Guevara et al. 2024). One prediction from these Galactic studies is thus that we may see a shallower version of these absorption profiles in other FSLs such as [C II] 158 μm, provided they are observed at at least comparable spatial and spectral resolution.
In low-redshift galaxies, only low spectral resolution and spatially unresolved 63 μm observations have been possible (Rosenberg et al. 2015; Israel et al. 2017; Kramer et al. 2020). These studies all mention the possible impact of [O I] 63 μm self-absorption, but only the intrinsic absorption within the clouds themselves can be considered within PDR models, as the foreground absorbing component with likely very different excitation conditions cannot be easily separated within the limited resolution element of the 3.5 m Herschel telescope. The observed ratio of the 63 to 145μm [O I] lines is close to the predicted values from PDR models, implying that the amount of [O I] 63 μm absorption should be relatively modest in these nearby galaxy samples (e.g. Fernández-Ontiveros et al. 2016). For those sources containing an AGN, the [O I] 63 μm flux may also have been boosted by the presence of X-ray dominated regions (e.g. Maloney et al. 1996; Dale et al. 2004; Brauher et al. 2008; Herrera-Camus et al. 2018). However, observational evidence of velocity-resolved [O I] 63 μm absorption has been seen in several Herschel spectra of (ultra-)luminous infrared galaxies ((U)LIRGs; González-Alfonso et al. 2012; Rosenberg et al. 2015; Díaz-Santos et al. 2017).
Interestingly, the 63 μm observational capabilities are significantly better in z > 4 galaxies than in all but the nearest Galactic star-forming regions; this is thanks to the very high spectral and spatial resolution capabilities of ALMA. The main limitation is the velocity spread of the different emitting clouds within the synthesised beam caused by galaxy rotation. Our detection of narrow escape channels –where we do detect [O I] 63 μm, as in region D of SPT0418-47– demonstrates that we are now reaching the required spatial and spectral resolution; this is possibly helped by the strong gravitational magnification in this source6, allowing us to reach spatial scales below 200 pc. Similarly, the two sources observed at < 0 05 resolution (SPT2132-58 and SPT2146-55), although they have more moderate lensing factors of μ ≈ 6, also reach spatial scales of 100–150 pc and show tentative [O I] 63 μm detections in some of the components (Fig. 5). Detailed lens modelling of the [O I] 63 μm dataset will be done in a future publication to determine the exact scales.
Despite these narrow line detections, the overall conclusion from our [O I] 63 μm survey in the SPT DSFGs is that they are affected by one to two orders of magnitude stronger absorption than the low-redshift ULIRGs (Fig. 9). A comparison with [O I] 63 μm in high-z DSFGs is difficult as most observations resulted in upper limits or very marginal detections (Coppin et al. 2012; Brisbin et al. 2015; Wardlow et al. 2017; Zhang et al. 2018; Wagg et al. 2020; Litke et al. 2022; Rybak et al. 2023; Ishii et al. 2025), with only one solid detection reported in an AGN-dominated source (Fernández Aranda et al. 2024). Only three literature high-z DSFGs have both [O I] 63 μm and [C II] 158 μm observed (Fig. 10), showing ratios comparable to the low-z DSFGs, suggesting a real difference compared to our SPT DSFG observations. However, publication bias against non-detections may strongly bias this small literature sample. In our statistically significant SPT DSFG [O I] 63 μm sample, the low [O I] 63 μm luminosity (Fig. 9) contrasts with their ‘normal’ [C II] (Fig. 8). We already considered and rejected the possibility that this could be due to fainter intrinsic [O I] 63 μm (Sect. 4.1, Hermans et al., in prep.). To completely suppress the [O I] 63 μm emission, these absorbers would need to cover a spread of velocities at least as wide as the emitting gas. Figure 7 zooms in on four strong absorbers; although we are severely limited by both the S/N and the fact that only integrated [C II] 158 μm profiles are available, in at least two cases the strongest [O I] 63 μm absorber seems to coincide with the peak of the [C II] 158 μm emission, suggesting that the absorbers are mostly following the overall kinematics of their host galaxies. The presence of absorption against the continuum -for example, in region A of SPT0106-64 – indicates that these are foreground clouds rather than peripheral regions of the emitting clouds. A foreground-neutral gas density of NH ≳ 1022 cm−2 is sufficient to cause discernable [O I] 63 μm absorption, because at such high column densities N(O) scales with N(H + H2); with lots of N(O) that is not excited in cold clouds, there is sub-thermally excited [O I] 63 μm ready to absorb any emission along the line of sight. Any photons that escaped the higher density, higher temperature, and higher optical-depth regions where the emission occurs would likely be absorbed along the line of sight, explaining why such absorbing clouds could be quite widespread in the SPT DSFGs. At the redshifts of our SPT DSFGs, an observed increase of the dense gas fraction from molecular tracers such as HCN, HNC, and HCO+ (Rybak et al. 2026) is also noted, which may explain the difference with local ULIRGs located in regions with a lower ISM density. While most of the oxygen is expected to be in the molecular rather than the atomic form, the overall density of foreground atomic oxygen susceptible to create absorption will likely also increase in these regions with a denser ISM. The strong [O I] 63 μm absorption may thus originate from the dense component of the interstellar, intergalactic or even circumgalactic media of these high-z DSFGs, while in local ULIRGs the star formation is more concentrated in episodical bursts of star formation in compact central regions (e.g. in Arp220, Martín et al. 2016), with less remaining dense gas along the line of sight.
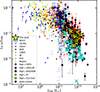 |
Fig. 8. L[CII]/LFIR versus LFIR with the 12 SPT DSFGs shown as yellow stars. The literature data are taken from FLAMES (Peng et al. 2025b), with references listed in Appendix A. The SPT DSFGs follow the general population. The cyan crosses show the SPICE-simulated data (Sect. 4.4), which slightly under-predict the L[CII]/LFIR. |
4.2.2. Implications
The implications of the strong [O I] 63 μm absorption are multiple. First, deep absorption features appear in some systems to have been measured in contrast to the level of the cosmic-microwave-background (CMB) radiation (i.e. down to flux densities equal to zero or below; see Fig. 7). The absorption troughs of this ground-state line transition are centred on the redshifted line frequency and appear as coincident with [C II] line features at the same velocities; see e.g. SPT0459-59. The CMB radiation temperature is ∼16 K at a fiducial z = 4.8. This low background temperature may yield absorption features in contrast to the CMB radiation if enough sub-thermally excited oxygen atoms in the ground state have a low enough excitation temperature to absorb the CMB photons. In the optically thin limit, with a fiducial gas kinetic temperature = 100 K, excitation temperatures reach Texc ∼ 25 K for both collisions with H and H2 for [O I] 63 μm at densities of ≤ 100 cm−3 and further down to 14.9 K at ≤ 1 cm−3 (Goldsmith 2019). [O I] 63 μm is sub-thermally excited in low-density conditions (n(H) < ncritical). Such conditions may exist in well-shielded, cold dust (10-15 K) in low-density clouds, for which these lines of sight can result in such absorption against the CMB radiation (Riechers et al. 2022). Due to the aperture-dependence of this absorption feature and the limited signal-to-noise ratio, the evidence for absorption of [O I] 63 μm in contrast to the redshifted CMB radiation will require a more systematic investigation with deeper integration times; this would ideally be done with additional information from the [O I] 145 μm transition to conduct a more robust radiative-transfer analysis and disentangle these potential [O I] 63 μm absorption-line features from the CMB radiation.
Second, the strength of the absorption makes it virtually impossible to recover the intrinsic [O I] 63 μm flux integrated over the entire range. Although the [O I] 145 μm line is predicted to be ∼10× fainter, it is a better choice for statistical studies of intrinsic line ratios involving the [O I] lines (e.g. Lee et al. 2021; De Breuck et al. 2019; Fudamoto et al. 2025).
Third, for a given column density, the [C II] line has an optical depth 4× lower than that of [O I] 63 μm (Decarli & Díaz-Santos 2025), meaning that for τ([O I] 63 μm) > 4, the [C II] 158 μm would also become optically thick. Given that in some sources > 99% of the expected [O I] 63 μm flux is absorbed, τ([O I] 63 μm) ≳ 4.5 and τ([C II]) ≳ 1.1. While this estimate is very rough and depends on other effects such as the C-O abundance ratio, it illustrates that optical depth effects in [C II] cannot be neglected (see also Gullberg et al. 2015). The contributions from the ionised gas phase to the [C II] line would dilute the [C II] self-absorption signal, but we expect these to be relatively modest given the relatively low [N II] 205 μm/[C II] ratios in the 12 sources in our sample (Fig. 11) suggesting that the neutral gas dominates the [C II] emission (Decarli et al. 2014; Cunningham et al. 2020). Additionally, as [C II] 158 μm traces less dense and more diffuse gas spread over much larger scales throughout the galaxies, the foreground [C II] 158 μm-absorbing gas would need to be even more widespread compared to [O I]; any [C II] 158 μm absorption would therefore likely be concentrated in smaller regions where the optical depth of the foreground material is higher. A tentative detection of [C II] 158 μm absorption can be seen in SPT0459-59 (see Fig. 7), which intriguingly coincides with the strongest dip in the [O I] 63 μm in terms of velocity, which is reminiscent of what is seen in Mon R2 and M17 SW (Guevara et al. 2024). Deeper [O I] 63 μm data and matched spatial-resolution [C II] 158 μm observations are required to determine the impact of optical-depth effects on the [C II] 158 μm emission. However, the fact that our strongly absorbed [O I] 63 μm sources follow the overall population in [C II] versus FIR (Fig. 8) suggests this is a modest effect when integrated over the full galaxy.
Fourth, absorbing gas is a powerful tracer of outflow (or inflow) kinematics, which has previously only been used in molecular lines such as OH (e.g. Spilker et al. 2020). Such studies can now also be considered for the more abundant atomic oxygen by looking for (inverse) P-Cygni profiles (e.g. Ishii et al. 2025).
Fifth, the fact that the foreground absorbing material is rich in oxygen implies it consists of chemically enriched rather than primordial material. This may argue for the absorbers to be located within the galaxies, though absorbed ionised metal lines are regularly found in rest-frame UV spectroscopy of z ∼ 3 radio galaxies (e.g. Kolwa et al. 2019).
4.3. The role of dust continuum
In addition to the above result that foreground clouds in the ISM can (almost) completely wipe out the [O I] 63 μm emission in the SPT DSFGs, we also find that the narrow [O I] 63 μm escape channels seem to occur only in regions without any dust continuum emission. This is most evident in SPT0418-47 (see Fig. 3), where our strongest [O I] 63 μm detection is located in the dust-free region D. To understand the origin of this effect, it is important to have an idea of the optical depth of the dust emission at λrest = 63 μm. Determining the optical depth requires photometric coverage on either side of the dust-continuum peak, which is generally only possible with spatially unresolved Herschel data covering the Wien side. The SPT DFSG sample has such coverage, and the peak is found to between λrest = 66 and 154 μm (Reuter et al. 2020). It it therefore likely that the dust opacity in the SPT DSFGs is non-negligible at λrest = 63 μm and may significantly attenuate the [O I] 63 μm line brightness when averaged across each system. One example is the Planck-Herschel-selected Red Radio Ring at z = 2.55, with λ0 ≃ 200 μm (Harrington et al. 2019). A foreground dust screen (i.e. a factor of eτ205) with a molecular gas column density of > 1024 cm−2, and molecular gas-to-dust mass ratio (GDMR) of 100, is found to reduce even the [N II] 205 μm line by a factor of ∼5 (Harrington et al. 2019); extrapolating this to [O I] 63 μm would imply a reduction by 100× or more for such a simplified dust screen. However, we note that values derived in Reuter et al. (2020), Harrington et al. (2019), and other studies often calculate the value at which dust becomes optically thick based a single dust component. The dust that is optically thick at 100 μm may be biased towards higher-column-density regions, which would in turn bias the derived dust opacities averaged over an entire source – even when the small source’s solid angle-emitting regions with the highest densities and dust optical depths represent a small fraction of the source. The solution is to obtain spatially resolved studies of the dust SEDs, which is becoming possible at z ≳ 4 when the peak shifts through ALMA Bands 10 and 9 (Fernández Aranda et al. 2025; Meyer et al. 2025; Algera et al. 2025). While there is a significant source-to-source variation, these studies find an increase of the optical depth towards the central regions of the galaxies, where the dust becomes optically thick around λrest = 100 μm. Our Band-10 continuum data of these 12 SPT DSFGs thus provides a powerful spatially resolved study of this dust continuum into the optically thick regime down to spatial resolutions of ∼100 pc in the source plane. Several SPT DSFGs have sub-arcsecond observations covering a range of wavelengths (see e.g. the Band-7 data in Figs. 1 to 6), which allowed us to determine the spatial variation of the dust opacity and compare them with our [O I] 63 μm data. We defer such a detailed study to future publications.
While it is clear that attenuation by optically thick dust may reduce the observed [O I] 63 μm flux, this cannot fully explain our results. First, dust attenuation would impact the full line profile, but we find cases where only part of the lines are absorbed, for example the narrow velocity absorbers against the continuum (see Fig. 7). Second, optically thick dust does not explain the preferential location of the [O I] 63 μm escape channels in areas of low dust continuum. A more straightforward interpretation is that at least part of the spatially resolved dust emission is optically thin. The observed continuum emission would then be a direct tracer of the dust mass along the line of sight. Assuming a constant gas/dust ratio, this would imply less absorbing gas in the locations of lower dust emission, creating the [O I] 63 μm escape channels. The low temperatures of cold, dust-rich molecular clouds of 20–50 K would also minimally impact the observed brightness temperatures of [O I] 63 μm (Goldsmith et al. 2021), leaving sub-thermally excited, oxygen-rich foreground material dispersed within the ISM to absorb the ground-state [O I] 63 μm line emission. Together, we conclude that the role of dust optical depth from foreground dust is less important than high line opacities in [O I] 63 μm emitting regions and the foreground cold molecular clouds dispersed throughout the DSFGs, the latter having large amounts of absorbing material that is sub-thermally excited and a high enough oxygen column density.
4.4. Comparison with simulations
Modelling oxygen lines in cosmological simulations remains challenging due to strong self-absorption and dependence on ISM modelling. Previous studies predict [O I] 63 μm observables (Ramos Padilla et al. 2023), albeit without the inclusion of self-absorption effects. More recently, Parente et al. (2026) found foreground self-absorption can reduce the [O I] 63 μm flux by a factor of 2–4. However, for ISM-sensitive lines such as [O I] 63 μm, resolving the multiphase ISM is key. In this work, we employed SPICE, a suite of cosmological radiation-hydrodynamical (RHD) simulations (Bhagwat et al. 2024). These simulations were performed with RAMSES-RT (Rosdahl et al. 2013; Rosdahl & Teyssier 2015), the coupled RHD extension of the Eulerian, adaptive-mesh refinement code RAMSES (Teyssier 2002). The key advantage of the SPICE simulations is their self-consistent tracking of radiation in five frequency bins including the Habing and ionising bands, which are essential for modelling [C II] and [O I] 63 μm lines in addition to the ∼30 − 60 pc resolution in the ISM/CGM. SPICE follows the non-equilibrium chemistry, which is fully coupled to the local radiation field for e−, H I, He II, and He III. Star formation in SPICE incorporates variable efficiencies within the ISM that respond to the local turbulent state of the gas (Kretschmer & Teyssier 2020). Feedback from these stars is injected in the form of radiative feedback (photo-ionisation and -heating) and radiation pressure on dust. Additionally, supernovae inject mass, metals (tracked and advected as passive scalars), and momentum back into the ISM, driving large-scale galactic outflows (see Bhagwat et al. (2024) for details). Dust in SPICE is coupled to H I chemistry such that the dust density is defined as 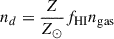 , where Z is the metallicity, fHI is the H I fraction, and ngas is the gas density. We used the ≈15 Mpc volume of SPICE with dark-matter and baryonic resolutions of ≈6.3 × 10⁵ M⊙ and ≈975 M⊙. Finally, we selected the more massive SPICE galaxies with 109 ≲ M★ ≲ 2 × 10¹⁰ M⊙ at z = 5–6, yielding a sample of 48 objects. This selection probes the low-mass regime of DSFGs and overlaps with the intrinsic stellar masses inferred for the SPT sources (Cathey et al. 2024). Moreover, the mock galaxies reached near-solar metallicities, consistently with the metallicity estimate reported for SPT0418-47 (De Breuck et al. 2019).
We modelled [O I] 63 μm, [C II], and [N II] 205 μm lines by assigning an emissivity to each gas cell in the simulation outputs (for details, see Bhagwat et al. in prep.) as
 (1)
(1)
For all lines, we also calculated the self-absorption by assigning an optical depth per cell and estimating an angle-averaged attenuation for 100 lines of sight out to the virial radius of each halo. The optical depth was defined as
![Mathematical equation: $$ \begin{aligned} \tau _{\nu _0} = \frac{c^3}{8 \pi \nu _0^3}A_{\rm ul} \frac{g_l}{Z(T_{\rm ex})} N_{\rm ion} \biggl [1 - \mathrm{exp}\biggl (-\frac{h\nu _0}{k T_{\rm ex}} \biggr )\biggr ] \frac{1}{\Delta \nu }, \end{aligned} $$](/articles/aa/full_html/2026/04/aa58699-25/aa58699-25-eq7.gif) (2)
(2)
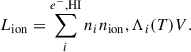
where ν0 is the rest frequency of given line, Aul is the spontaneous emission coefficient, gl and gu are the level degeneracies, 𝒵(Tex) = gl + guexp(−91.2/Tex) is the partition function (in the case of [C II] 158 μm), Nion is the column density of ion in consideration, Δν is the Doppler width, and Tex is the excitation temperature for the transition. All line ratios and luminosities presented in this work were integrated over the galaxy ignoring instrumental effects.
The results from the simulations are plotted as cyan crosses in Figs. 8, 9, 10, and 11. The SPICE data slightly under-predict the [C II] luminosities and have a large scatter on the [N II] 205 μm, which may originate from the very different ionisation states of gas from the different feedback in SPICE. However, the model predictions are close to the highly absorbed [O I] 63 μm luminosities (Fig. 9), suggesting that we should detect the emission with integrations reaching a 2–10× lower rms than our relatively short integrations of 15-30 minutes. Overall, this comparison highlights the critical importance of self-absorption when making predictions of optically thick lines such as [O I] 63 μm.
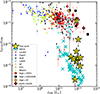 |
Fig. 9. L[OI]63/LFIR versus LFIR with the 12 SPT DSFGs shown as yellow stars. The literature data are taken from FLAMES (Peng et al. 2025b), with references listed in Appendix A. The SPT DSFGs are up to > 100× fainter than the literature counterparts. The cyan crosses show the SPICE-simulated data (Sect. 4.4), which are very consistent with the observed SPT DFSGs. |
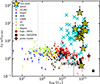 |
Fig. 10. L[CII]/L[OI]63 versus LFIR with the 12 SPT DSFGs shown as yellow stars. The literature data are taken from FLAMES (Peng et al. 2025b), with references listed in Appendix A. The SPT DSFGs are up to > 100× fainter in [O I] 63 μm than the literature counterparts. The cyan crosses show the SPICE-simulated data (Sect. 4.4), which are slightly lower than the observed SPT DFSGs. |
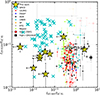 |
Fig. 11. L[NII]205/L[CII] versus L[OI]63/L[CII] with the nine SPT DSFGs shown as yellow stars. The literature data are taken from FLAMES (Peng et al. 2025b), with references listed in Appendix A. As in Fig. 8, the SPT DSFGs are consistent with the literature counterparts in L[NII]205/L[CII], while they are offset in L[OI]63/L[CII]. The cyan crosses show the SPICE-simulated data (Sect. 4.4), which are slightly higher in L[NII]205/L[CII] than the observed SPT DFSGs, which may be a combination of over-predicted [C II] 158 μm and over-predicted [N II] 205 μm. |
5. Conclusions
We carried out the first dedicated ALMA survey of the [O I] 63 μm fine-structure line in a relatively large sample of 12 gravitationally lensed DSFGs at z > 4. Our main conclusions are as follows.
-
Despite reaching sensitivities significantly deeper than previous high-redshift studies, we only detect tentative [O I] 63 μm emission in two out of 12 sources. The remaining galaxies show non-detections that extend the dynamic range of existing constraints by one to two orders of magnitude after strong gravitational lensing considerations.
-
The low [O I] 63 μm luminosities cannot be readily attributed to intrinsically weak line emission, as other far-infrared fine-structure lines –such as [C II] 158 μm and [N II] 205 μm, and in four cases also [O I] 145 μm– are detected at levels consistent with comparable galaxy populations. The observations instead imply substantial absorption of the [O I] 63 μm line by low-excitation neutral gas within widespread molecular clouds in these DSFGs, together with high line optical depths in the regions where [O I] 63 μm emission occurs.
-
The anti-correlation between [O I] 63 μm emission and the brightest dust continuum regions suggests that line absorption effects, rather than high dust optical depths at 63μm, are primarily responsible for suppressing the observed line emission. This can explain the low [O I] 63 μm detection rate in the SPT DSFG, which was selected by its cold dust emission at millimetre wavelengths (Vieira et al. 2010). As a corollary, differently selected galaxies may have a higher [O I] 63 μm detection rate. Future resolved dust SED modelling will further inform the role of infrared radiation field and dust continuum effects for these 100–150 parsec-sized regions.
-
Several sources exhibit [O I] 63 μm absorption against the dust continuum, while others show narrow (∼20 km s−1), spatially offset emission components. These signatures add observational evidence indicating that the [O I] 63 μm line is subject to strong optical depth and kinematically distinct self-absorption effects. Although the S/N is limited, several absorption troughs appear to reach levels below the CMB. This suggests the presence of low-excitation temperature (Tex ≤ TCMB), low-density gas along those lines of sight.
-
These high-resolution observations suggest that galaxy-integrated [O I] 63 μm measurements in high-redshift DSFGs cannot reliably trace the intrinsic cooling rate or density of the neutral ISM. Together with the optically thinner tracer, such as the [O I] 145 μm line, it may be possible to disentangle some of the more complicated radiative-transfer effects.
In summary, our results show that the [O I] 63 μm line is strongly affected by absorption in z > 4 DSFGs, limiting its diagnostic power when interpreted in isolation. Future observations combining matched-resolution spectroscopy, spatially resolved dust-continuum measurements, and detailed lens modelling will be essential to disentangle intrinsic emission from absorption effects and to fully exploit the diagnostic potential of far-infrared fine-structure lines at high redshift to recover the underlying physical conditions of the interstellar medium of active galaxies in the early Universe.
Acknowledgments
We thank Juan Pablo Pérez Beaupuits for stimulating discussions linking our high redshift results with very similar Galactic data, and Jarle Brinchman for useful suggestions. We thank for the anonymous referee for a very careful reading which allowed us to better emphasise several unexpected results from our observations. This paper makes use of the following ALMA data: ADS/JAO.ALMA#2024.0.01465.S, 2021.1.00857.S, 2016.1.00231.S, 2019.1.01026.S, 2021.1.00252.S, 2019.1.00253.S, 2015.1.00942.S, and 2018.1.00046.S. ALMA is a partnership of ESO (representing its member states), NSF (USA) and NINS (Japan), together with NRC (Canada), NSTC and ASIAA (Taiwan), and KASI (Republic of Korea), in cooperation with the Republic of Chile. The Joint ALMA Observatory is operated by ESO, AUI/NRAO and NAOJ. IDL acknowledges support through funding from the European Research Council (ERC) under the European Union’s Horizon 2020 research and innovation program DustOrigin (ERC-2019-StG-851622), and from the Flemish Fund for Scientific Research (FWO-Vlaanderen) through the research project G0A1523N.
References
- Abel, N. P., Ferland, G. J., Shaw, G., & van Hoof, P. A. M. 2005, ApJS, 161, 65 [NASA ADS] [CrossRef] [Google Scholar]
- Abel, N. P., Dudley, C., Fischer, J., Satyapal, S., & van Hoof, P. A. M. 2009, ApJ, 701, 1147 [Google Scholar]
- Algera, H. S. B., Herrera-Camus, R., Aravena, M., et al. 2025, A&A, submitted [arXiv:2512.02320] [Google Scholar]
- Aravena, M., Bertoldi, F., Schinnerer, E., et al. 2008, A&A, 491, 173 [NASA ADS] [CrossRef] [EDP Sciences] [Google Scholar]
- Aravena, M., Spilker, J. S., Bethermin, M., et al. 2016, MNRAS, 457, 4406 [Google Scholar]
- Asaki, Y., Maud, L. T., Fomalont, E. B., et al. 2020a, AJ, 160, 59 [Google Scholar]
- Asaki, Y., Maud, L. T., Fomalont, E. B., et al. 2020b, ApJS, 247, 23 [NASA ADS] [CrossRef] [Google Scholar]
- Asaki, Y., Maud, L. T., Francke, H., et al. 2023, ApJ, 958, 86 [NASA ADS] [Google Scholar]
- Baluteau, J.-P., Cox, P., Cernicharo, J., et al. 1997, A&A, 322, L33 [Google Scholar]
- Baryshev, A. M., Hesper, R., Mena, F. P., et al. 2015, A&A, 577, A129 [NASA ADS] [CrossRef] [EDP Sciences] [Google Scholar]
- Beelen, A., Cox, P., Benford, D. J., et al. 2006, ApJ, 642, 694 [NASA ADS] [CrossRef] [Google Scholar]
- Bhagwat, A., Costa, T., Ciardi, B., Pakmor, R., & Garaldi, E. 2024, MNRAS, 531, 3406 [NASA ADS] [CrossRef] [Google Scholar]
- Borys, C., Blain, A. W., Dey, A., et al. 2006, ApJ, 636, 134 [Google Scholar]
- Bothwell, M. S., Aguirre, J. E., Aravena, M., et al. 2017, MNRAS, 466, 2825 [Google Scholar]
- Brauher, J. R., Dale, D. A., & Helou, G. 2008, ApJS, 178, 280 [NASA ADS] [CrossRef] [Google Scholar]
- Brisbin, D., Ferkinhoff, C., Nikola, T., et al. 2015, ApJ, 799, 13 [Google Scholar]
- Capak, P. L., Carilli, C., Jones, G., et al. 2015, Nature, 522, 455 [NASA ADS] [CrossRef] [Google Scholar]
- CASA Team (Bean, B., et al.) 2022, PASP, 134, 114501 [NASA ADS] [CrossRef] [Google Scholar]
- Cathey, J., Gonzalez, A. H., Lower, S., et al. 2024, ApJ, 967, 11 [NASA ADS] [CrossRef] [Google Scholar]
- Conley, A., Cooray, A., Vieira, J. D., et al. 2011, ApJ, 732, L35 [NASA ADS] [CrossRef] [Google Scholar]
- Coppin, K. E. K., Danielson, A. L. R., Geach, J. E., et al. 2012, MNRAS, 427, 520 [NASA ADS] [CrossRef] [Google Scholar]
- Cormier, D., Madden, S. C., Lebouteiller, V., et al. 2015, A&A, 578, A53 [CrossRef] [EDP Sciences] [Google Scholar]
- Cormier, D., Abel, N. P., Hony, S., et al. 2019, A&A, 626, A23 [NASA ADS] [CrossRef] [EDP Sciences] [Google Scholar]
- Cortes, P., Carpenter, J., Kameno, S., et al. 2025, ALMA Cycle 12 Technical Handbook [Google Scholar]
- Crawford, M. K., Genzel, R., Townes, C. H., & Watson, D. M. 1985, ApJ, 291, 755 [Google Scholar]
- Cunningham, D. J. M., Chapman, S. C., Aravena, M., et al. 2020, MNRAS, 494, 4090 [NASA ADS] [CrossRef] [Google Scholar]
- Díaz-Santos, T., Assef, R. J., Blain, A. W., et al. 2016, ApJ, 816, L6 [Google Scholar]
- Díaz-Santos, T., Armus, L., Charmandaris, V., et al. 2017, ApJ, 846, 32 [Google Scholar]
- Díaz-Santos, T., Assef, R. J., Blain, A. W., et al. 2018, Science, 362, 1034 [Google Scholar]
- Díaz-Santos, T., Assef, R. J., Eisenhardt, P. R. M., et al. 2021, A&A, 654, A37 [NASA ADS] [CrossRef] [EDP Sciences] [Google Scholar]
- Dale, D. A., Helou, G., Brauher, J. R., et al. 2004, ApJ, 604, 565 [NASA ADS] [CrossRef] [Google Scholar]
- De Breuck, C., Weiß, A., Béthermin, M., et al. 2019, A&A, 631, A167 [NASA ADS] [CrossRef] [EDP Sciences] [Google Scholar]
- De Looze, I., Cormier, D., Lebouteiller, V., et al. 2014, A&A, 568, A62 [NASA ADS] [CrossRef] [EDP Sciences] [Google Scholar]
- Decarli, R., & Díaz-Santos, T. 2025, A&ARv, 33, 4 [Google Scholar]
- Decarli, R., Walter, F., Carilli, C., et al. 2014, ApJ, 782, L17 [NASA ADS] [CrossRef] [Google Scholar]
- Decarli, R., Walter, F., Venemans, B. P., et al. 2018, ApJ, 854, 97 [Google Scholar]
- Dimaratos, A., Cormier, D., Bigiel, F., & Madden, S. C. 2015, A&A, 580, A135 [NASA ADS] [CrossRef] [EDP Sciences] [Google Scholar]
- Downes, D., Neri, R., Wiklind, T., Wilner, D. J., & Shaver, P. A. 1999, ApJ, 513, L1 [NASA ADS] [CrossRef] [Google Scholar]
- Farrah, D., Lebouteiller, V., Spoon, H. W. W., et al. 2013, ApJ, 776, 38 [Google Scholar]
- Ferkinhoff, C., Brisbin, D., Nikola, T., et al. 2015, ApJ, 806, 260 [NASA ADS] [CrossRef] [Google Scholar]
- Fernández Aranda, R., Díaz Santos, T., Hatziminaoglou, E., et al. 2024, A&A, 682, A166 [NASA ADS] [CrossRef] [EDP Sciences] [Google Scholar]
- Fernández Aranda, R., Díaz Santos, T., Hatziminaoglou, E., et al. 2025, A&A, 695, L15 [NASA ADS] [CrossRef] [EDP Sciences] [Google Scholar]
- Fernández-Ontiveros, J. A., Spinoglio, L., Pereira-Santaella, M., et al. 2016, ApJS, 226, 19 [CrossRef] [Google Scholar]
- Fischer, J., Luhman, M. L., Satyapal, S., et al. 1999, Ap&SS, 266, 91 [NASA ADS] [CrossRef] [Google Scholar]
- Fischer, J., Abel, N. P., González-Alfonso, E., et al. 2014, ApJ, 795, 117 [NASA ADS] [CrossRef] [Google Scholar]
- Fudamoto, Y., Inoue, A. K., Bouwens, R., et al. 2025, ApJ, submitted [arXiv:2504.03831] [Google Scholar]
- Gerin, M., Ruaud, M., Goicoechea, J. R., et al. 2015, A&A, 573, A30 [NASA ADS] [CrossRef] [EDP Sciences] [Google Scholar]
- Giulietti, M., Lapi, A., Massardi, M., et al. 2023, ApJ, 943, 151 [NASA ADS] [CrossRef] [Google Scholar]
- Goldsmith, P. F. 2019, ApJ, 887, 54 [NASA ADS] [CrossRef] [Google Scholar]
- Goldsmith, P. F., Langer, W. D., Seo, Y., et al. 2021, ApJ, 916, 6 [NASA ADS] [CrossRef] [Google Scholar]
- González-Alfonso, E., Fischer, J., Graciá-Carpio, J., et al. 2012, A&A, 541, A4 [NASA ADS] [CrossRef] [EDP Sciences] [Google Scholar]
- Guevara, C., Stutzki, J., Ossenkopf-Okada, V., et al. 2020, A&A, 636, A16 [CrossRef] [EDP Sciences] [Google Scholar]
- Guevara, C., Stutzki, J., Ossenkopf-Okada, V., et al. 2024, A&A, 690, A294 [NASA ADS] [CrossRef] [EDP Sciences] [Google Scholar]
- Gullberg, B., De Breuck, C., Vieira, J. D., et al. 2015, MNRAS, 449, 2883 [Google Scholar]
- Gusdorf, A., Anderl, S., Lefloch, B., et al. 2017, A&A, 602, A8 [NASA ADS] [CrossRef] [EDP Sciences] [Google Scholar]
- Hailey-Dunsheath, S., Nikola, T., Stacey, G. J., et al. 2010, ApJ, 714, L162 [Google Scholar]
- Harrington, K. C., Vishwas, A., Weiß, A., et al. 2019, MNRAS, 488, 1489 [NASA ADS] [CrossRef] [Google Scholar]
- Harrington, K. C., Vishwas, A., Man, A. W. S., et al. 2025, A&A, 701, A298 [NASA ADS] [CrossRef] [EDP Sciences] [Google Scholar]
- Herrera-Camus, R., Sturm, E., Graciá-Carpio, J., et al. 2018, ApJ, 861, 94 [Google Scholar]
- Herrera-Camus, R., Förster Schreiber, N., Genzel, R., et al. 2021, A&A, 649, A31 [NASA ADS] [CrossRef] [EDP Sciences] [Google Scholar]
- Howell, J. H., Armus, L., Mazzarella, J. M., et al. 2010, ApJ, 715, 572 [Google Scholar]
- Hunter, T. R., Indebetouw, R., Brogan, C. L., et al. 2023, PASP, 135, 074501 [NASA ADS] [CrossRef] [Google Scholar]
- Ishii, N., Hashimoto, T., Ferkinhoff, C., et al. 2025, PASJ, 77, 139 [NASA ADS] [CrossRef] [Google Scholar]
- Israel, F. P., Güsten, R., Meijerink, R., Requena-Torres, M. A., & Stutzki, J. 2017, A&A, 599, A53 [NASA ADS] [CrossRef] [EDP Sciences] [Google Scholar]
- Ivison, R. J., Swinbank, A. M., Swinyard, B., et al. 2010, A&A, 518, L35 [NASA ADS] [CrossRef] [EDP Sciences] [Google Scholar]
- Ivison, R. J., Swinbank, A. M., Smail, I., et al. 2013, ApJ, 772, 137 [NASA ADS] [CrossRef] [Google Scholar]
- Ivison, R. J., Lewis, A. J. R., Weiss, A., et al. 2016, ApJ, 832, 78 [Google Scholar]
- Jackson, J. M., Whitaker, J. S., Chambers, E., et al. 2024, ApJ, 965, 187 [Google Scholar]
- Kamenetzky, J., Rangwala, N., Glenn, J., Maloney, P. R., & Conley, A. 2016, ApJ, 829, 93 [Google Scholar]
- Kepley, A. A., Tsutsumi, T., Brogan, C. L., et al. 2020, PASP, 132, 024505 [Google Scholar]
- Kolupuri, S., Decarli, R., Neri, R., et al. 2025, A&A, 695, A201 [NASA ADS] [CrossRef] [EDP Sciences] [Google Scholar]
- Kolwa, S., Vernet, J., De Breuck, C., et al. 2019, A&A, 625, A102 [NASA ADS] [CrossRef] [EDP Sciences] [Google Scholar]
- Kraemer, K. E., Jackson, J. M., & Lane, A. P. 1998, ApJ, 503, 785 [NASA ADS] [CrossRef] [Google Scholar]
- Kramer, C., Nikola, T., Anderl, S., et al. 2020, A&A, 639, A61 [NASA ADS] [CrossRef] [EDP Sciences] [Google Scholar]
- Kretschmer, M., & Teyssier, R. 2020, MNRAS, 492, 1385 [Google Scholar]
- Lamarche, C., Verma, A., Vishwas, A., et al. 2018, ApJ, 867, 140 [NASA ADS] [CrossRef] [Google Scholar]
- Lamarche, C., Stacey, G. J., Vishwas, A., et al. 2019, ApJ, 882, 1 [NASA ADS] [CrossRef] [Google Scholar]
- Lambert, T. S., Posses, A., Aravena, M., et al. 2023, MNRAS, 518, 3183 [Google Scholar]
- Lapham, R. C., Young, L. M., & Crocker, A. 2017, ApJ, 840, 51 [Google Scholar]
- Lee, M. M., Nagao, T., De Breuck, C., et al. 2021, ApJ, 913, 41 [NASA ADS] [CrossRef] [Google Scholar]
- Leurini, S., Wyrowski, F., Wiesemeyer, H., et al. 2015, A&A, 584, A70 [NASA ADS] [CrossRef] [EDP Sciences] [Google Scholar]
- Lique, F., Kłos, J., Alexander, M. H., Le Picard, S. D., & Dagdigian, P. J. 2018, MNRAS, 474, 2313 [NASA ADS] [CrossRef] [Google Scholar]
- Lis, D. C., Keene, J., Phillips, T. G., et al. 2001, ApJ, 561, 823 [NASA ADS] [CrossRef] [Google Scholar]
- Litke, K. C., Marrone, D. P., Spilker, J. S., et al. 2019, ApJ, 870, 80 [Google Scholar]
- Litke, K. C., Marrone, D. P., Aravena, M., et al. 2022, ApJ, 928, 179 [NASA ADS] [CrossRef] [Google Scholar]
- Litke, K. C., Marrone, D. P., Aravena, M., et al. 2023, ApJ, 949, 87 [CrossRef] [Google Scholar]
- Lu, N., Zhao, Y., Díaz-Santos, T., et al. 2017, ApJS, 230, 1 [Google Scholar]
- Lutz, D., Sturm, E., Tacconi, L. J., et al. 2007, ApJ, 661, L25 [NASA ADS] [CrossRef] [Google Scholar]
- Madden, S. C., Rémy-Ruyer, A., Galametz, M., et al. 2013, PASP, 125, 600 [NASA ADS] [CrossRef] [Google Scholar]
- Madden, S. C., Cormier, D., Hony, S., et al. 2020, A&A, 643, A141 [NASA ADS] [CrossRef] [EDP Sciences] [Google Scholar]
- Magdis, G. E., Daddi, E., Elbaz, D., et al. 2011, ApJ, 740, L15 [NASA ADS] [CrossRef] [Google Scholar]
- Magdis, G. E., Daddi, E., Béthermin, M., et al. 2012, ApJ, 760, 6 [NASA ADS] [CrossRef] [Google Scholar]
- Magdis, G. E., Rigopoulou, D., Hopwood, R., et al. 2014, ApJ, 796, 63 [Google Scholar]
- Mahieu, S., Maier, D., Lazareff, B., et al. 2012, IEEE Trans. Terahertz Sci. Technol., 2, 29 [Google Scholar]
- Malhotra, S., Kaufman, M. J., Hollenbach, D., et al. 2001, ApJ, 561, 766 [Google Scholar]
- Maloney, P. R., Hollenbach, D. J., & Tielens, A. G. G. M. 1996, ApJ, 466, 561 [Google Scholar]
- Martín, S., Aalto, S., Sakamoto, K., et al. 2016, A&A, 590, A25 [NASA ADS] [CrossRef] [EDP Sciences] [Google Scholar]
- Massardi, M., Stoehr, F., Bendo, G. J., et al. 2021, PASP, 133, 085001 [NASA ADS] [CrossRef] [Google Scholar]
- Maud, L. T., Asaki, Y., Fomalont, E. B., et al. 2020, ApJS, 250, 18 [Google Scholar]
- Maud, L. T., Asaki, Y., Dent, W. R. F., et al. 2022, ApJS, 259, 10 [Google Scholar]
- Maud, L. T., Asaki, Y., Nagai, H., et al. 2023a, ApJS, 267, 24 [Google Scholar]
- Maud, L. T., Pérez-Sánchez, A. F., Asaki, Y., et al. 2023b, ALMA Memo 624 [arXiv:2304.08318] [Google Scholar]
- Messias, H., Dye, S., Nagar, N., et al. 2014, A&A, 568, A92 [NASA ADS] [CrossRef] [EDP Sciences] [Google Scholar]
- Meyer, R. A., Walter, F., Cicone, C., et al. 2022, ApJ, 927, 152 [NASA ADS] [CrossRef] [Google Scholar]
- Meyer, R. A., Walter, F., Di Mascia, F., et al. 2025, A&A, 695, L18 [NASA ADS] [CrossRef] [EDP Sciences] [Google Scholar]
- Mookerjea, B., Sandell, G., Güsten, R., et al. 2019, A&A, 626, A131 [NASA ADS] [CrossRef] [EDP Sciences] [Google Scholar]
- Nagao, T., Maiolino, R., Marconi, A., & Matsuhara, H. 2011, A&A, 526, A149 [NASA ADS] [CrossRef] [EDP Sciences] [Google Scholar]
- Pallottini, A., Ferrara, A., Gallerani, S., et al. 2022, MNRAS, 513, 5621 [NASA ADS] [Google Scholar]
- Parente, M., Bischetti, M., Maio, U., et al. 2026, A&A, 705, A39 [NASA ADS] [CrossRef] [EDP Sciences] [Google Scholar]
- Peng, B., Lamarche, C., Stacey, G. J., et al. 2021, ApJ, 908, 166 [NASA ADS] [CrossRef] [Google Scholar]
- Peng, B., Arrigoni Battaia, F., Vishwas, A., et al. 2025a, A&A, 694, L1 [NASA ADS] [CrossRef] [EDP Sciences] [Google Scholar]
- Peng, B., Lamarche, C., Ball, C., et al. 2025b, ApJS, submitted [arXiv:2507.10702] [Google Scholar]
- Peng, B., Vishwas, A., Lamarche, C., et al. 2025c, ApJS, submitted [arXiv:2507.11829] [Google Scholar]
- Planck Collaboration XIII. 2016, A&A, 594, A13 [NASA ADS] [CrossRef] [EDP Sciences] [Google Scholar]
- Podigachoski, P., Barthel, P. D., Haas, M., et al. 2015, A&A, 575, A80 [NASA ADS] [CrossRef] [EDP Sciences] [Google Scholar]
- Poglitsch, A., Herrmann, F., Genzel, R., et al. 1996, ApJ, 462, L43 [NASA ADS] [CrossRef] [Google Scholar]
- Ramos Padilla, A. F., Wang, L., van der Tak, F. F. S., & Trager, S. C. 2023, A&A, 679, A131 [NASA ADS] [CrossRef] [EDP Sciences] [Google Scholar]
- Reuter, C., Vieira, J. D., Spilker, J. S., et al. 2020, ApJ, 902, 78 [NASA ADS] [CrossRef] [Google Scholar]
- Richings, A. J., Faucher-Giguère, C.-A., & Stern, J. 2021, MNRAS, 503, 1568 [Google Scholar]
- Riechers, D. A., Weiss, A., Walter, F., et al. 2022, Nature, 602, 58 [NASA ADS] [CrossRef] [Google Scholar]
- Rigopoulou, D., Pereira-Santaella, M., Magdis, G. E., et al. 2018, MNRAS, 473, 20 [NASA ADS] [CrossRef] [Google Scholar]
- Rooney, C., Peng, B., Vishwas, A., et al. 2025, ApJ, 987, 61 [Google Scholar]
- Rosdahl, J., & Teyssier, R. 2015, MNRAS, 449, 4380 [Google Scholar]
- Rosdahl, J., Blaizot, J., Aubert, D., Stranex, T., & Teyssier, R. 2013, MNRAS, 436, 2188 [Google Scholar]
- Rosenberg, M. J. F., van der Werf, P. P., Aalto, S., et al. 2015, ApJ, 801, 72 [Google Scholar]
- Rybak, M., Hodge, J. A., Vegetti, S., et al. 2020a, MNRAS, 494, 5542 [NASA ADS] [CrossRef] [Google Scholar]
- Rybak, M., Zavala, J. A., Hodge, J. A., Casey, C. M., & Werf, P. v. d. 2020b, ApJ, 889, L11 [NASA ADS] [CrossRef] [Google Scholar]
- Rybak, M., Lemsom, L., Lundgren, A., et al. 2023, Res. Notes Am. Astron. Soc., 7, 188 [Google Scholar]
- Rybak, M., Sallaberry, G., Hodge, J. A., et al. 2026, A&A, 706, A69 [NASA ADS] [CrossRef] [EDP Sciences] [Google Scholar]
- Saintonge, A., Lutz, D., Genzel, R., et al. 2013, ApJ, 778, 2 [Google Scholar]
- Schneider, N., Röllig, M., Simon, R., et al. 2018, A&A, 617, A45 [NASA ADS] [CrossRef] [EDP Sciences] [Google Scholar]
- Spilker, J. S., Marrone, D. P., Aravena, M., et al. 2016, ApJ, 826, 112 [NASA ADS] [CrossRef] [Google Scholar]
- Spilker, J. S., Phadke, K. A., Aravena, M., et al. 2020, ApJ, 905, 85 [Google Scholar]
- Spinoglio, L., Pereira-Santaella, M., Dasyra, K. M., et al. 2015, ApJ, 799, 21 [NASA ADS] [CrossRef] [Google Scholar]
- Spinoglio, L., Fernández-Ontiveros, J. A., Malkan, M. A., et al. 2022, ApJ, 926, 55 [NASA ADS] [CrossRef] [Google Scholar]
- Stacey, G. J., Geis, N., Genzel, R., et al. 1991, ApJ, 373, 423 [NASA ADS] [CrossRef] [Google Scholar]
- Stacey, G. J., Hailey-Dunsheath, S., Ferkinhoff, C., et al. 2010, ApJ, 724, 957 [NASA ADS] [CrossRef] [Google Scholar]
- Stacey, H. R., McKean, J. P., Robertson, N. C., et al. 2018, MNRAS, 476, 5075 [NASA ADS] [CrossRef] [Google Scholar]
- Strandet, M. L., Weiss, A., Vieira, J. D., et al. 2016, ApJ, 822, 80 [NASA ADS] [CrossRef] [Google Scholar]
- Sturm, E., Verma, A., Graciá-Carpio, J., et al. 2010, A&A, 518, L36 [NASA ADS] [CrossRef] [EDP Sciences] [Google Scholar]
- Sutter, J., Dale, D. A., Croxall, K. V., et al. 2019, ApJ, 886, 60 [NASA ADS] [CrossRef] [Google Scholar]
- Tadaki, K.-I., Tsujita, A., Tamura, Y., et al. 2022, PASJ, 74, L9 [NASA ADS] [CrossRef] [Google Scholar]
- Teyssier, R. 2002, A&A, 385, 337 [CrossRef] [EDP Sciences] [Google Scholar]
- Tielens, A. G. G. M., & Hollenbach, D. 1985, ApJ, 291, 722 [Google Scholar]
- Uzawa, Y., Fujii, Y., Gonzalez, A., et al. 2013, Phys. C Superconductivity, 494, 189 [Google Scholar]
- Uzgil, B. D., Bradford, C. M., Hailey-Dunsheath, S., Maloney, P. R., & Aguirre, J. E. 2016, ApJ, 832, 209 [CrossRef] [Google Scholar]
- Valtchanov, I., Virdee, J., Ivison, R. J., et al. 2011, MNRAS, 415, 3473 [NASA ADS] [CrossRef] [Google Scholar]
- Vastel, C., Polehampton, E. T., Baluteau, J.-P., et al. 2002, ApJ, 581, 315 [NASA ADS] [CrossRef] [Google Scholar]
- Venemans, B. P., Walter, F., Neeleman, M., et al. 2020, ApJ, 904, 130 [Google Scholar]
- Vieira, J. D., Crawford, T. M., Switzer, E. R., et al. 2010, ApJ, 719, 763 [NASA ADS] [CrossRef] [Google Scholar]
- Wagg, J., Aravena, M., Brisbin, D., et al. 2020, MNRAS, 499, 1788 [NASA ADS] [CrossRef] [Google Scholar]
- Wang, R., Wagg, J., Carilli, C. L., et al. 2013, ApJ, 773, 44 [Google Scholar]
- Wardlow, J. L., Cooray, A., De Bernardis, F., et al. 2013, ApJ, 762, 59 [NASA ADS] [CrossRef] [Google Scholar]
- Wardlow, J. L., Cooray, A., Osage, W., et al. 2017, ApJ, 837, 12 [NASA ADS] [CrossRef] [Google Scholar]
- Weiß, A., Henkel, C., Downes, D., & Walter, F. 2003, A&A, 409, L41 [NASA ADS] [CrossRef] [EDP Sciences] [Google Scholar]
- Weiß, A., Downes, D., Neri, R., et al. 2007, A&A, 467, 955 [NASA ADS] [CrossRef] [EDP Sciences] [Google Scholar]
- Weiß, A., De Breuck, C., Marrone, D. P., et al. 2013, ApJ, 767, 88 [Google Scholar]
- Wolfire, M. G., Vallini, L., & Chevance, M. 2022, ARA&A, 60, 247 [NASA ADS] [CrossRef] [Google Scholar]
- Yang, J., Venemans, B., Wang, F., et al. 2019, ApJ, 880, 153 [NASA ADS] [CrossRef] [Google Scholar]
- Zanella, A., Daddi, E., Magdis, G., et al. 2018, MNRAS, 481, 1976 [Google Scholar]
- Zavala, J. A., Montaña, A., Hughes, D. H., et al. 2018, Nat. Astron., 2, 56 [Google Scholar]
- Zhang, Z.-Y., Ivison, R. J., George, R. D., et al. 2018, MNRAS, 481, 59 [CrossRef] [Google Scholar]
- Zhao, Y., Lu, N., Xu, C. K., et al. 2016, ApJ, 819, 69 [Google Scholar]
At this redshift, the [O I] 63 μm falls at frequency with a particularly low atmospheric transmission, limiting the sensitivity.
The time taken from the start of a phase calibrator scan, followed by the slew to the target, the target scan, and the slew back to the phase calibrator ready to start the next scan.
Exact observed frequencies at listed in Col. 3 of Table 1.
Amplification  , with μ = 32.7 (Spilker et al. 2016).
Available from https://irsa.ipac.caltech.edu/cgi-bin/Gator/nph-scan?submit=Selectprojshort=HERSCHEL and
Appendix A: Literature data origin
The plotted low-z data are taken from FLAMES-low catalogue in Peng et al. (2025b), sourced from, SHINING (Herrera-Camus et al. 2018), DGS (Madden et al. 2013; Cormier et al. 2015, 2019), HERCULES (Rosenberg et al. 2015), HERUS (Farrah et al. 2013), Díaz-Santos et al. (2017), Fernández-Ontiveros et al. (2016), Zhao et al. (2016), Brauher et al. (2008), Fischer et al. (2014), Howell et al. (2010), Kamenetzky et al. (2016), Peng et al. (2021), Spinoglio et al. (2022), Spinoglio et al. (2015), Dimaratos et al. (2015), Lu et al. (2017), Lapham et al. (2017), Sutter et al. (2019). The plotted high-z data are taken from FLAMES-high catalogue in Peng et al. (2025b), sourced from Tadaki et al. (2022), Reuter et al. (2020), Fernández Aranda et al. (2025), Wagg et al. (2020), Wardlow et al. (2013), Aravena et al. (2016), Rybak et al. (2020b), Zhang et al. (2018), Kolupuri et al. (2025), Litke et al. (2022), Díaz-Santos et al. (2016), Saintonge et al. (2013), Zavala et al. (2018), Magdis et al. (2011), Borys et al. (2006), Uzgil et al. (2016), Fernández Aranda et al. (2024), Beelen et al. (2006), Lutz et al. (2007), Brauher et al. (2008), Podigachoski et al. (2015), Díaz-Santos et al. (2018), Aravena et al. (2008), Giulietti et al. (2023), Lamarche et al. (2019), Sturm et al. (2010), Magdis et al. (2014), Ishii et al. (2025), Ivison et al. (2010), Ferkinhoff et al. (2015), Cunningham et al. (2020), Weiß et al. (2007), Wardlow et al. (2017), Ivison et al. (2013), Rybak et al. (2023), Díaz-Santos et al. (2021), Litke et al. (2019), Hailey-Dunsheath et al. (2010), Valtchanov et al. (2011), Messias et al. (2014), Stacey et al. (2010), Weiß et al. (2003), Venemans et al. (2020), Stacey et al. (2018), Wang et al. (2013), Coppin et al. (2012), Ivison et al. (2016), Rigopoulou et al. (2018), Lamarche et al. (2018), Magdis et al. (2012), Rybak et al. (2020a), Conley et al. (2011), Decarli et al. (2018), Gullberg et al. (2015), Downes et al. (1999), and Rooney et al. (2025).
Appendix B: Flux calibration
As described in Sect. 2.1, the photometric accuracy of high-frequency observations is affected by several uncertainties which generally lead to a lower observed flux than reality. We here compare the observed line+continuum fluxes (which given the strong self-absorption are expected to be dominated by continuum) with published fluxes from Herschel. We collected both the published fluxes obtained with HIPE v9.0 (Reuter et al. 2020) as well as those derived from the SPIRE point source catalogue7. The latter fluxes are derived using the timeline fitter method8.
Table B.1 presents these fluxes. We find that there are very good matches in five cases (SPT0243-49, SPT0441-46, SPT0459-58, SPT0459-59, and SPT2132-58), while in six sources only 40–80% of the Herschel flux is recovered. This discrepancy could be partially due to the flux decoherence effects described in Sect. 2.2, but we do not find a clear trend with higher phase rms or larger distance to the calibrators. As the Herschel/SPIRE beam is 25″ or 35″ at 350μm or 500μm, respectively, it is also possible that nearby companions were included, which are not covered in the ALMA apertures of 0 8 to 6″ size. We therefore conclude that while remaining absolute flux calibration uncertainties remain in these high-frequency data, this does not appear to be a systematic trend, as half of our fluxes are consistent with those from Herschel.
Source Photometry: ALMA compared to Herschel/SPIRE.
Flux measurements.
Appendix C: Notes on individual sources
We here provide an overview of each source, explaining our motivation for defining the apertures listed in Table B.2.
C.1. SPT0106-64
This source consists of an incomplete lensing arc (aperture G), surrounded by two very bright continuum sources (apertures A and B). Within the arc, we add an aperture C on the continuum peak, as well as three apertures D, E, and F where some tentative narrow [O I] 63 μm emission may escape.
C.2. SPT0136-63
This source consists of a curved arc with several continuum peaks. Aperture A marks a small gap in the continuum emission where some tentative [O I] 63 μm emission escapes. Apertures B and C show even more tentative emission at the prolongation of the arc where also some Band 7 emission was detected (B).
C.3. SPT0155-62
This source was detected at the very edge of the Band 10 primary beam, leading to a strongly varying sensitivity over the Einstein ring, and less reliable photometry. We detect no [O I] 63 μm at the continuum peak aperture A, but tentative emission in aperture B. Deeper data at the phase centre are required to confirm this.
C.4. SPT0243-49
This is one of the two sources observed in Band 9, leading to slightly worse spatial resolution. No [O I] 63 μm is detected at the continuum peak aperture A. We do find tentative emission in the larger aperture D, which we investigate deeper in the smaller apertures B and C; especially in the latter, the narrow emission appears stronger.
C.5. SPT0418-47
This well-studied source consists of a full Einstein Ring (aperture A). We adopt the nomenclature of (Peng et al. 2025a) for the companion source components B and C. We also add apertures C, E and F on the continuum peaks in the Einstein ring. Intriguingly, aperture D in the main continuum gap of the ring has the strongest [O I] 63 μm emission.
C.6. SPT0441-46
This source consists of two bright parts of an Einstein ring. Tentative [O I] 63 μm absorption could be seen against the brightest continuum clump A, with emission in component D at the same velocity range.
C.7. SPT0459-58
This source is the only one showing an [O I] 63 μm detection in the Full aperture. The brightest continuum aperture A shows tentative [O I] 63 μm absorption, which is not seen in the other aperture B.
C.8. SPT0459-59
This source is composed of many clumps. Aperture A shows tentative [O I] 63 μm in emission, which aperture B shows it in absorption at a similar velocity offset.
C.9. SPT2132-58
This source consists of a bright continuum component A, showing no [O I] 63 μm/ in emission nor absorption, though some tentative emission may be seen in a small aperture. Other tentative emission near the well-defined [C II] 158 μm redshift is seen in apertures B and C.
C.10. SPT2146-55
This source was observed later in Cycle 11 with a larger antenna configuration, meaning it is potentially over-resolved. Only the brightest continuum components A and D detected in continuum. We split aperture A into apertures B and C, with the former showing some narrow [O I] 63 μm emission in B, but none in C.
C.11. SPT2311-54
The bright continuum component B shows no [O I] 63 μm but the more diffuse emission in aperture A shows tentative [O I] 63 μm covering almost the entire [C II] 158 μm line width.
C.12. SPT2351-57
This compact source is barely resolved in the continuum, but some tentative [O I] 63 μm emission is seen at the edge of the source in aperture A. We define a double aperture B showing tentative [O I] 63 μm absorption, which we split in apertures C and D.
All Tables
All Figures
|
Fig. 1. Overview of the results for SPT0106-64 and SPT0136-63 The central panel shows the Band 10 or 9 line+continuum image (at central frequency listed in Table 1) in colour with the archival Band 7 continuum in white contours for reference. The beam sizes for both images are shown as red and white filled ellipses. The apertures used in Table B.2 are marked in red, and the extracted line+continuum spectra are shown in the left and right side panels. The top panel shows the continuum-subtracted [O I] 63 μm spectrum in yellow with the appropriate atmospheric transmission in both the signal and image band overplotted in blue and grey, respectively. The [C II] 158 μm spectra from APEX or the ALMA 7m-array are overplotted in black, and where available, the [N II] 205 μm spectrum is overplotted in green, with the scaling factors marked in the legend. |
| In the text | |
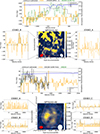 |
Fig. 2. Overview of SPT0155-62 and SPT0243-49 as in Fig. 1. |
| In the text | |
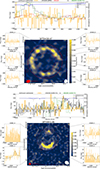 |
Fig. 3. Overview of SPT0418-47 and SPT0441-46 as in Fig. 1. |
| In the text | |
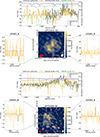 |
Fig. 4. Overview of SPT0459-58 and SPT0459-59 as in Fig. 1. |
| In the text | |
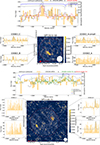 |
Fig. 5. Overview of SPT2132-58 and SPT2146-55 as in Fig. 1. |
| In the text | |
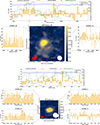 |
Fig. 6. Overview of SPT2311-54 and SPT2351-57 as in Fig. 1. |
| In the text | |
|
Fig. 7. Zoomed-in view of [O I] 63 μm spectra of the four targets showing tentative absorption against the continuum with integrated [C II] 158 μm lines overlaid as black lines. See Figs. 1 to 6 for the full spectra. |
| In the text | |
|
Fig. 8. L[CII]/LFIR versus LFIR with the 12 SPT DSFGs shown as yellow stars. The literature data are taken from FLAMES (Peng et al. 2025b), with references listed in Appendix A. The SPT DSFGs follow the general population. The cyan crosses show the SPICE-simulated data (Sect. 4.4), which slightly under-predict the L[CII]/LFIR. |
| In the text | |
|
Fig. 9. L[OI]63/LFIR versus LFIR with the 12 SPT DSFGs shown as yellow stars. The literature data are taken from FLAMES (Peng et al. 2025b), with references listed in Appendix A. The SPT DSFGs are up to > 100× fainter than the literature counterparts. The cyan crosses show the SPICE-simulated data (Sect. 4.4), which are very consistent with the observed SPT DFSGs. |
| In the text | |
|
Fig. 10. L[CII]/L[OI]63 versus LFIR with the 12 SPT DSFGs shown as yellow stars. The literature data are taken from FLAMES (Peng et al. 2025b), with references listed in Appendix A. The SPT DSFGs are up to > 100× fainter in [O I] 63 μm than the literature counterparts. The cyan crosses show the SPICE-simulated data (Sect. 4.4), which are slightly lower than the observed SPT DFSGs. |
| In the text | |
|
Fig. 11. L[NII]205/L[CII] versus L[OI]63/L[CII] with the nine SPT DSFGs shown as yellow stars. The literature data are taken from FLAMES (Peng et al. 2025b), with references listed in Appendix A. As in Fig. 8, the SPT DSFGs are consistent with the literature counterparts in L[NII]205/L[CII], while they are offset in L[OI]63/L[CII]. The cyan crosses show the SPICE-simulated data (Sect. 4.4), which are slightly higher in L[NII]205/L[CII] than the observed SPT DFSGs, which may be a combination of over-predicted [C II] 158 μm and over-predicted [N II] 205 μm. |
| In the text | |
Current usage metrics show cumulative count of Article Views (full-text article views including HTML views, PDF and ePub downloads, according to the available data) and Abstracts Views on Vision4Press platform.
Data correspond to usage on the plateform after 2015. The current usage metrics is available 48-96 hours after online publication and is updated daily on week days.
Initial download of the metrics may take a while.