Fig. 11.
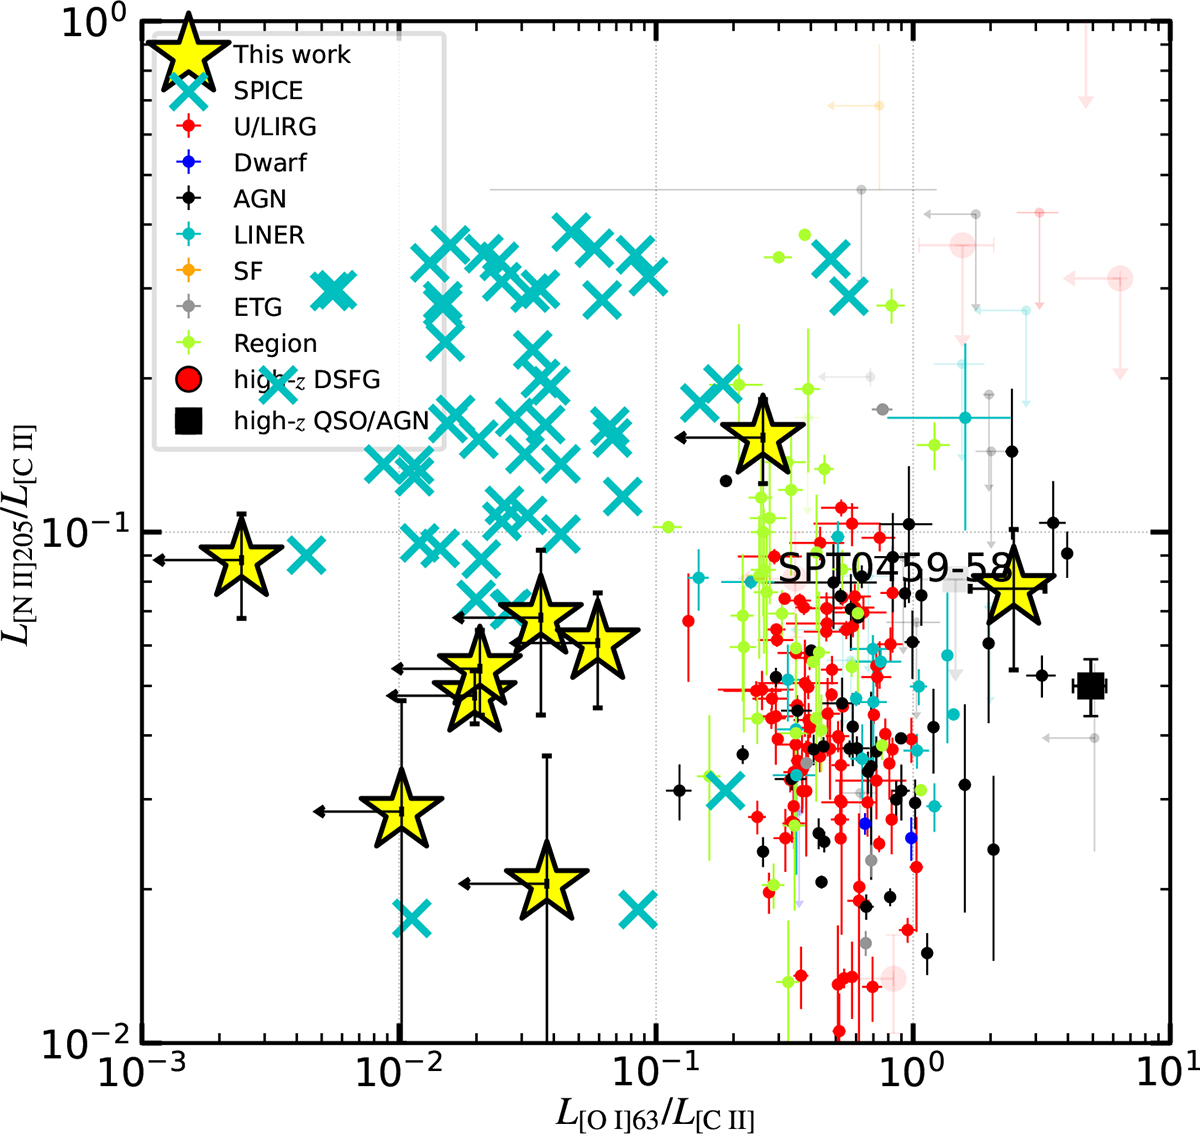
Download original image
L[NII]205/L[CII] versus L[OI]63/L[CII] with the nine SPT DSFGs shown as yellow stars. The literature data are taken from FLAMES (Peng et al. 2025b), with references listed in Appendix A. As in Fig. 8, the SPT DSFGs are consistent with the literature counterparts in L[NII]205/L[CII], while they are offset in L[OI]63/L[CII]. The cyan crosses show the SPICE-simulated data (Sect. 4.4), which are slightly higher in L[NII]205/L[CII] than the observed SPT DFSGs, which may be a combination of over-predicted [C II] 158 μm and over-predicted [N II] 205 μm.
Current usage metrics show cumulative count of Article Views (full-text article views including HTML views, PDF and ePub downloads, according to the available data) and Abstracts Views on Vision4Press platform.
Data correspond to usage on the plateform after 2015. The current usage metrics is available 48-96 hours after online publication and is updated daily on week days.
Initial download of the metrics may take a while.