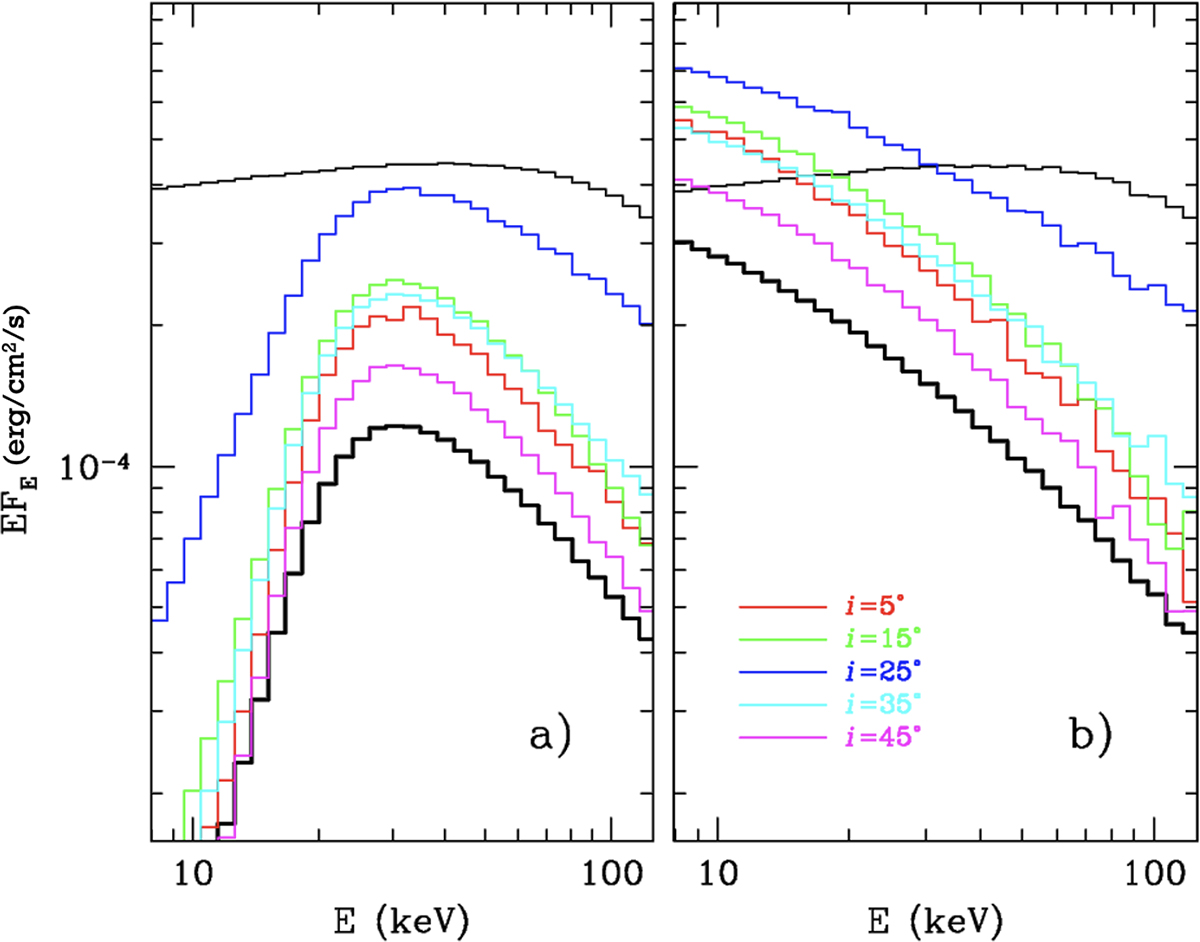
Fig. 12.
Download original image
Spectra of the component reflected by the toroidal material obscuring the central source. Panel (a): Case of cold, non-ionized plasma. Panel (b): Fully ionized case (but note that Compton up-scattering is not taken into account). The thin black line is the primary emission (we assumed a thermal Comptonization of kTe = 100 keV), the thick black line shows the angle-averaged reflected component, and the colored lines show the dependence of the reflected spectra on the viewing angle, i, for i < 50°.
Current usage metrics show cumulative count of Article Views (full-text article views including HTML views, PDF and ePub downloads, according to the available data) and Abstracts Views on Vision4Press platform.
Data correspond to usage on the plateform after 2015. The current usage metrics is available 48-96 hours after online publication and is updated daily on week days.
Initial download of the metrics may take a while.