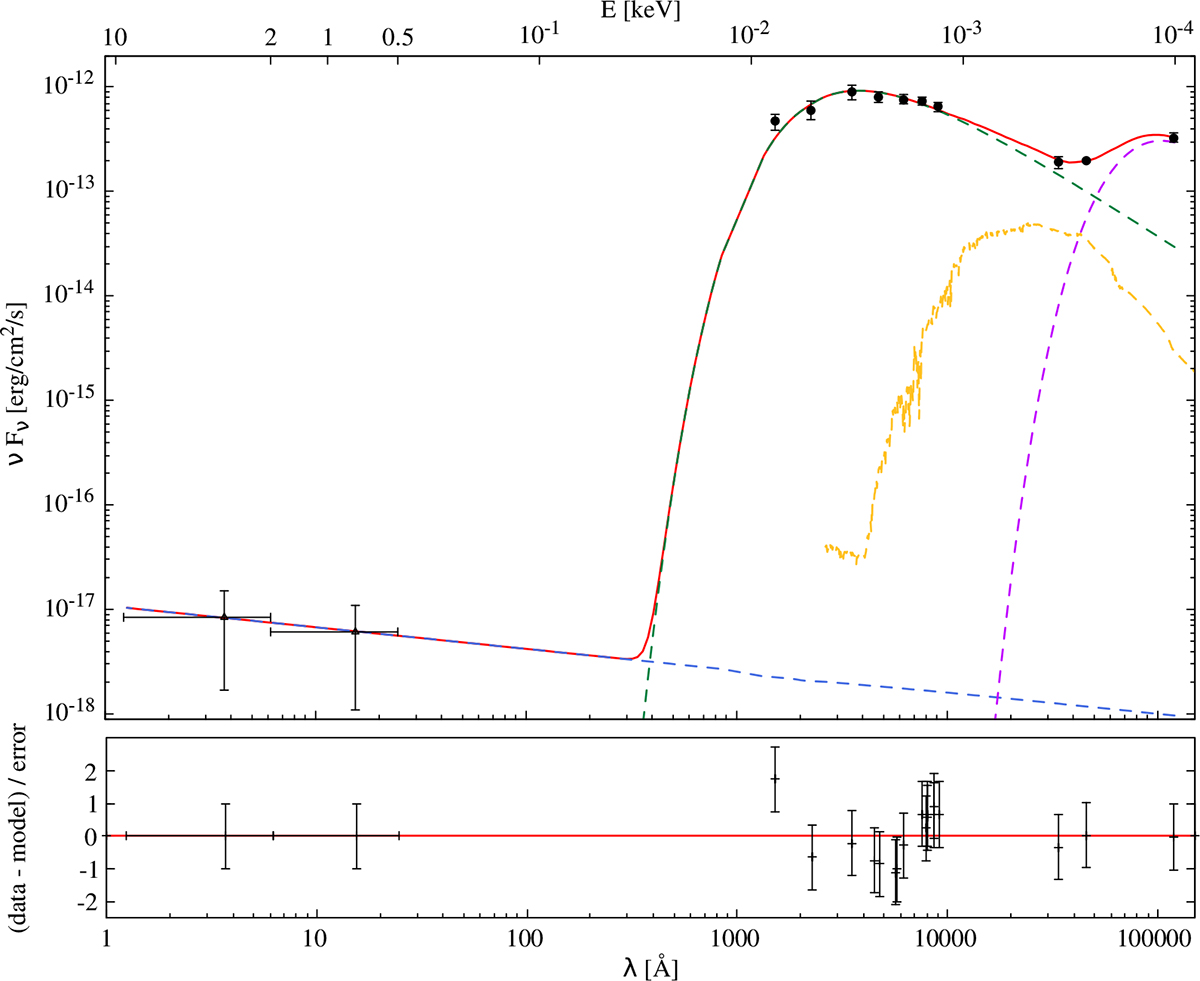
Fig. 7.
Download original image
Broadband SED fit of SDSS J101353 using Model 1a: kerrbb + power-law components. Top panel: Best-fit model (solid red line) to the data (black dots). The dashed green and blue lines represent kerrbb and power-law components, respectively. The starlight and torus contributions are shown in yellow and violet, respectively. Bottom panel: Residuals of χ2 related to the total model.
Current usage metrics show cumulative count of Article Views (full-text article views including HTML views, PDF and ePub downloads, according to the available data) and Abstracts Views on Vision4Press platform.
Data correspond to usage on the plateform after 2015. The current usage metrics is available 48-96 hours after online publication and is updated daily on week days.
Initial download of the metrics may take a while.