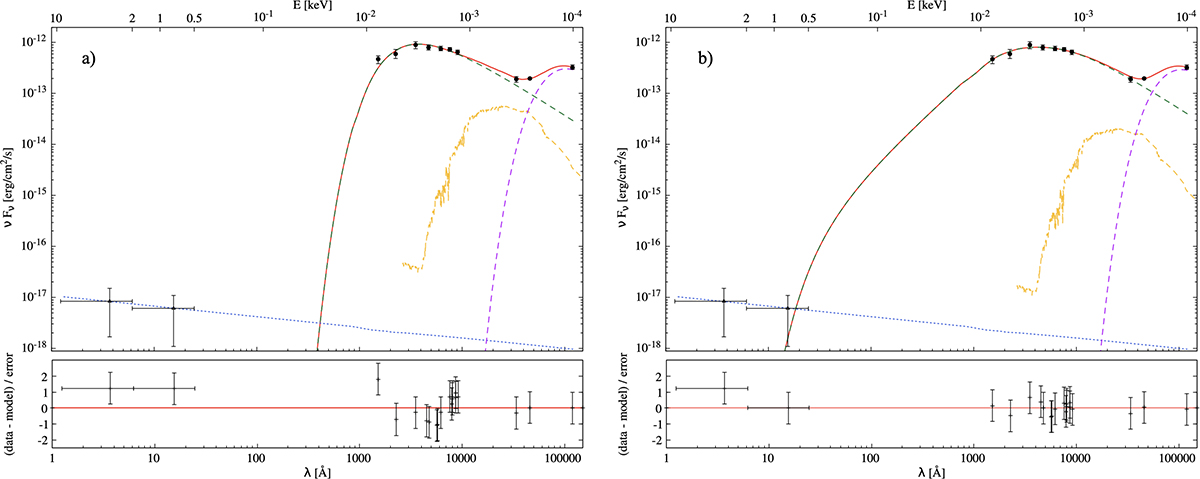
Fig. 9.
Download original image
Broadband SED fit of SDSS J101353 using relagn model. Panel (a): Accretion disk with a very weak and compact hot corona configuration (Model 1b). Panel (b): Same configuration as in (a) but leaving the warm region parameters free (Model 2). Top subpanels: Best-fit model (solid red line) to the data (black dots). The dashed green line represents the relagn component. The starlight and torus contributions are shown in yellow and violet, respectively. An artificial power law (dotted blue line) is displayed to show the contribution of a compact weak hot corona. Bottom subpanels: Residuals of χ2 related to the total model in red (without taking the artificial power law into account).
Current usage metrics show cumulative count of Article Views (full-text article views including HTML views, PDF and ePub downloads, according to the available data) and Abstracts Views on Vision4Press platform.
Data correspond to usage on the plateform after 2015. The current usage metrics is available 48-96 hours after online publication and is updated daily on week days.
Initial download of the metrics may take a while.