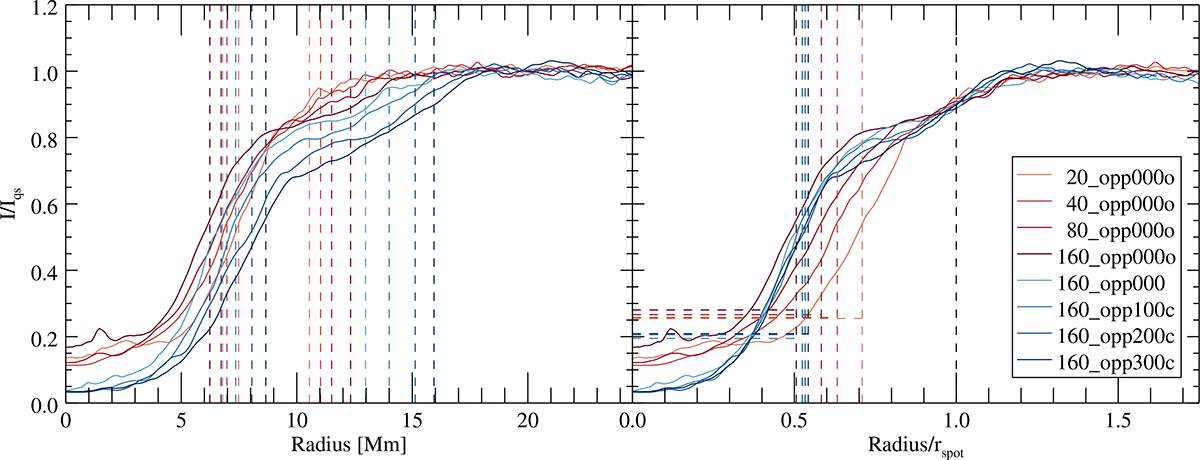
Fig. 2.
Download original image
Azimuthally averaged intensity, I/Iqs, (solid lines) as a function of radius in Mm and fraction of the spot radius. The colours indicate the simulations listed in the inset legend. For the older runs (with names ending in ‘o’ in red), the bolometric intensity is shown, and for the other runs (blue), the continuum intensity is shown. Vertical dashed lines show the position of the umbral (left panel with R < 10 Mm, right panel R < 1) and spot boundaries (left panel R > 10 Mm, right panel R = 1 black). The horizontal dashed lines in the right panel show the average umbral intensity. Values corresponding to the location of the vertical dashed lines are given in Table 2, columns ru, rs, ru/s.
Current usage metrics show cumulative count of Article Views (full-text article views including HTML views, PDF and ePub downloads, according to the available data) and Abstracts Views on Vision4Press platform.
Data correspond to usage on the plateform after 2015. The current usage metrics is available 48-96 hours after online publication and is updated daily on week days.
Initial download of the metrics may take a while.