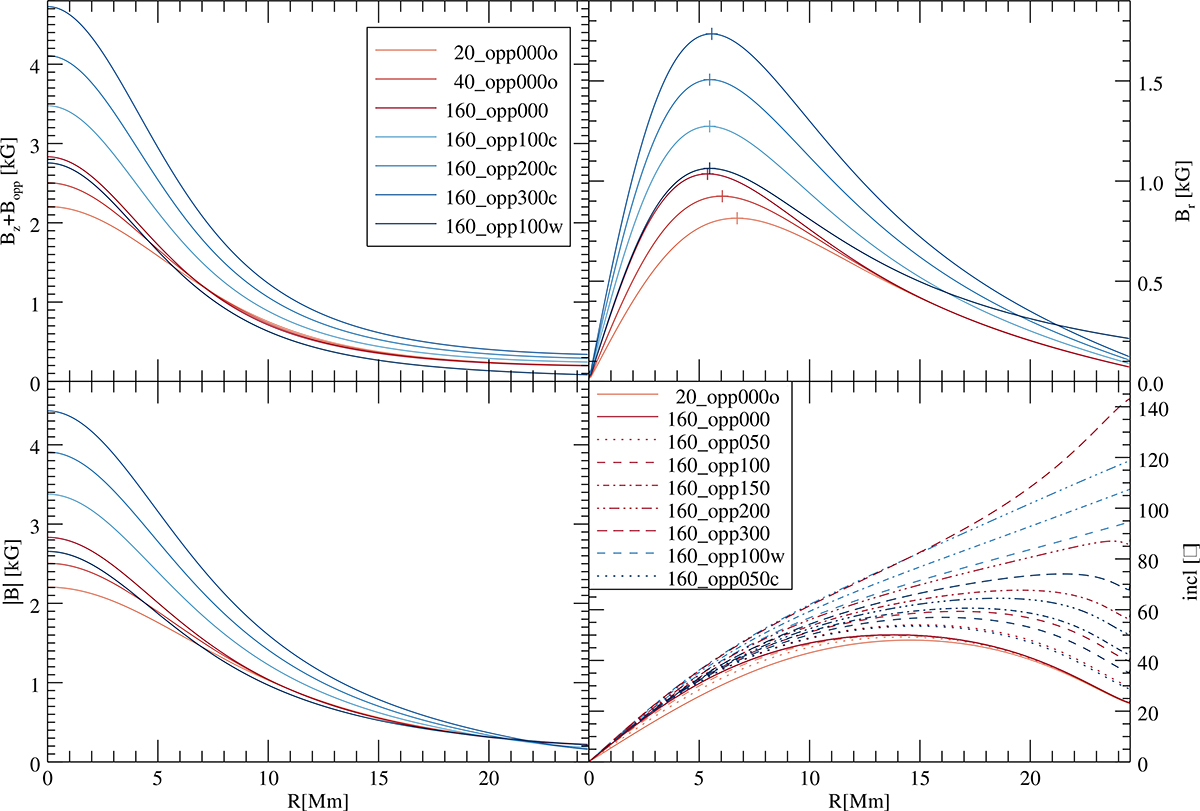
Fig. A.1.
Download original image
Initial magnetic field. Vertical field Bz + Bopp (top left), radial field Br (top right), total field |B| (bottom left), and inclination to the surface normal γ. The legend in the top left panel shows the simulations plotted in the first three panels. The legend in the bottom right panel gives a selection of the simulations shown there, the rest is given in Table A.1; for each line in that table (colour), the further right the column is (the higher B0 or Bopp, the changing numbers in the run names), the higher the inclination.
Current usage metrics show cumulative count of Article Views (full-text article views including HTML views, PDF and ePub downloads, according to the available data) and Abstracts Views on Vision4Press platform.
Data correspond to usage on the plateform after 2015. The current usage metrics is available 48-96 hours after online publication and is updated daily on week days.
Initial download of the metrics may take a while.