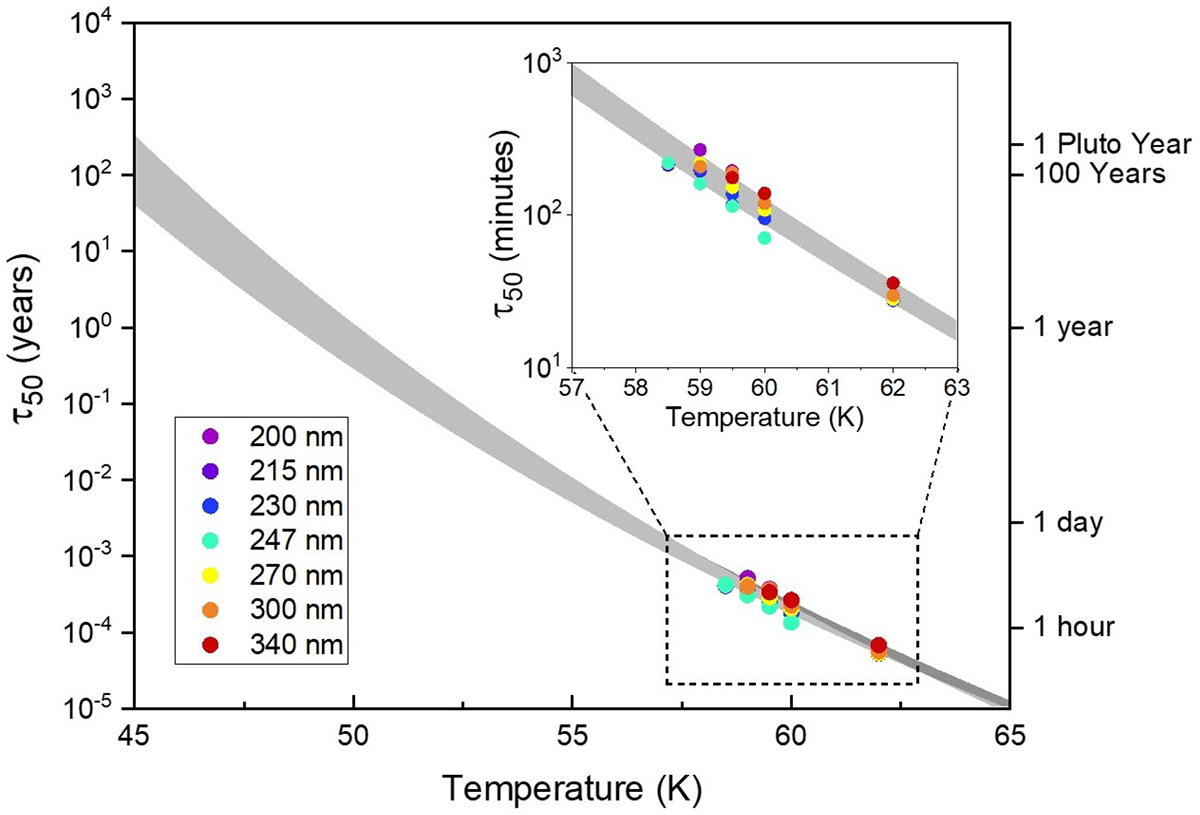
Fig. 2.
Download original image
Time required for the reflectance of solid ethane at wavelengths shorter than 400 nm to decrease by 50% (τ50) as a function of temperature. Circular symbols represent experimental measurements between 57.5 K and 62 K at selected wavelengths in the reflectance spectra. The shaded region indicates the range of reddening timescales – bounded by the maximum and minimum values derived from Arrhenius fits across all measured wavelengths. The strong temperature dependence implies that reddening becomes progressively slower at lower temperatures, extending to century-long timescales near 45 K.
Current usage metrics show cumulative count of Article Views (full-text article views including HTML views, PDF and ePub downloads, according to the available data) and Abstracts Views on Vision4Press platform.
Data correspond to usage on the plateform after 2015. The current usage metrics is available 48-96 hours after online publication and is updated daily on week days.
Initial download of the metrics may take a while.