| Issue |
A&A
Volume 708, April 2026
|
|
|---|---|---|
| Article Number | L6 | |
| Number of page(s) | 6 | |
| Section | Letters to the Editor | |
| DOI | https://doi.org/10.1051/0004-6361/202558817 | |
| Published online | 01 April 2026 | |
Letter to the Editor
Thermal clustering of solid ethane with potential relevance to Charon’s Mordor region
1
University of Texas at San Antonio, Department of Physics and Astronomy, San Antonio, TX, 78249, USA
2
Center for Laboratory Astrophysics and Space Science Experiments (CLASSE), Southwest Research Institute, Space Science Division, San Antonio, TX, 78238, USA
3
Southwest Research Institute, Space Science Division, San Antonio, TX, 78238, USA
4
Lowell Observatory, Flagstaff, AZ, 86001, USA
5
Northern Arizona University, Department of Astronomy and Planetary Science, Flagstaff, AZ, 86011, USA
★ Corresponding author: This email address is being protected from spambots. You need JavaScript enabled to view it.
Received:
29
December
2025
Accepted:
4
March
2026
Abstract
The methane condensed in Charon’s winter hemisphere undergoes photolysis by interplanetary medium Lyman-α photons, which yields solid ethane as the dominant photoproduct. With the onset of spring, the photolyzed surface experiences increased surface temperatures and solar wind exposure, conditions that promote further structural and chemical modification. We report laboratory measurements that show solid ethane undergoes a marked spectral reddening when thermally processed at Charon’s subsolar maximum temperature of ∼60 K. The reddening follows an Arrhenius temperature dependence, proceeding on hour timescales at 60 K but requiring on the order of 100 years at 45 K. This behavior is consistent with thermally driven diffusion and aggregation of ethane molecules into nanoclusters that preferentially scatter shorter wavelengths. On Charon, simultaneous solar wind radiolysis may convert ethane nanoclusters into higher-order nonvolatile organic nanoclusters that can plausibly account for the observed reddish polar hue of the object.
Key words: scattering / planets and satellites: surfaces / Kuiper belt objects: individual: Charon
© The Authors 2026
 Open Access article, published by EDP Sciences, under the terms of the Creative Commons Attribution License (https://creativecommons.org/licenses/by/4.0), which permits unrestricted use, distribution, and reproduction in any medium, provided the original work is properly cited.
This article is published in open access under the Subscribe to Open model. This email address is being protected from spambots. You need JavaScript enabled to view it. to support open access publication.
1. Introduction
Images acquired by the Multispectral Visible Imaging Camera (MVIC) during the 2015 New Horizons flyby revealed a distinct reddish coloration across Charon’s northern polar region (Stern et al. 2015; Grundy et al. 2016a). The color is most pronounced north of 70° latitude, within the region informally named Mordor Macula (Stern et al. 2015; Grundy et al. 2016b). Charon’s surface is continuously illuminated by diffuse Lyman-α radiation produced by the scattering of solar Lyman-α photons by interplanetary hydrogen (Gladstone et al. 2015). Grundy et al. (2016b) proposed that the reddish hue arises from tholin-like refractories generated by this interplanetary medium Lyman-α (IPM Ly-α) photolysis of methane that has escaped from Pluto and has subsequently been cold-trapped on Charon’s winter pole. Similar photolyzed residues may also account for the poleward darkening detected in Long Range Reconnaissance Imager (LORRI) observations of Charon’s southern hemisphere.
Teolis et al. (2022) and Raut et al. (2022) further developed the framework proposed by Grundy et al. (2016b) to reassess the contribution of IPM Ly-α irradiation to Charon’s near surface chemistry. Their studies have introduced two critical advances: a Charon exosphere model that provides time- and position-dependent methane accretion rates, and dynamic photolysis experiments that replicate concurrent Ly-α irradiation and methane deposition under Charon-like conditions. These studies found that the photo-conversion of methane to refractories strongly depends on ϕ, the ratio of the methane deposition rate to Ly-α flux. Photolysis under low-ϕ conditions produces increasingly complex refractory organics, while high-ϕ conditions favor the formation of simpler products such as ethane. At Charon, the polar regions experience enhanced methane accretion resulting from “polar swapping” of unprocessed methane transferred from the summer pole to the winter pole; hence, Charon’s mid-latitudes likely accumulate complex organics formed under low-ϕ regimes, whereas high-ϕ photolysis of the thick “equinoctial frost” at the poles primarily yields ethane (Raut et al. 2022). Optical constants of solid ethane (Khare et al. 1990) indicate that it is largely colorless at visible wavelengths, suggesting that photolytic ethane alone cannot explain Charon’s distinctly red polar zones.
Given the limited data on the visible optical properties of solid ethane, we conducted reflectance spectroscopy measurements between 190 and 1100 nm to better constrain its spectral behavior under Charon-like temperature conditions. Experiments included ethane condensed directly onto a gold coated quartz crystal microbalance (QCM) and onto a micrometer-thick water ice layer, representative of Charon’s water ice dominated surface. Remarkably, ethane condensed near 60 K showed pronounced reddening in its specular reflectance even in the absence of irradiation, while ices formed at 10–20 K were spectrally neutral. Moreover, ethane films initially deposited at 10 K reddened substantially when warmed and held near 60 K, with the reddening rate increasing rapidly with temperature. These results demonstrate that solid ethane, under the conditions of Charon’s polar zones, becomes optically scattering, possibly due to thermal diffusion of ethane molecules that leads to re-organization of the solid into ethane nanoglobules or nanoclusters.
2. Methods
Our experiments were performed in the Mordor ultra-high vacuum chamber (Raut et al. 2022, chamber schematic included in Fig. A.1) cryo-pumped to a base pressure of ∼10−10 torr. Thin films (water ice, ethane) were deposited onto a cryo-cooled polished QCM by introducing gases through dedicated dosers at controlled rates (2.5 − 4.0 × 10¹⁴ molecules cm−2 s−1). The QCM’s resonant frequency (∼6 MHz) decreased in proportion to the adhered mass during deposition, allowing for precise measurement of the areal mass of the ice film (Allodi et al. 2013). The film mass was converted to column density in monolayers (ML, where 1 ML ∼1015 molecules cm−2) by dividing by the molecular mass. The film thickness was calculated from the QCM-derived column mass divided by the ice density.
To simulate Charon’s water ice rich subsurface (Protopapa et al. 2021), we first deposited a ∼1000 ML (∼0.25 μm) thick water ice film onto the QCM at 140 K, producing a crystalline ice layer (Raut et al. 2007; Mitchell et al. 2017). Following the water ice deposition, the film was cooled to 10 K prior to the condensation of ethane ice. The thin ethane ice films (∼200 ML; ∼0.16 μm) were deposited atop the water ice layer at 10 K and subsequently warmed and then held at temperatures between 55 and 60 K, close to Charon’s subsolar maximum temperature. The ethane ice deposited at 10 K was amorphous, then became crystalline upon warming to 60 K (Hudson et al. 2009, 2014). Reflectance spectra were recorded every 30 min over a 4.5-hour period to track changes as a function of annealing time at a given temperature. The ethane films deposited at 10 K in our experiments may differ in microstructure from the ethane on Charon, which is thought to form through IPM Ly-α photolysis of Plutonian methane that is cold-trapped in the winter polar region. Following the spring sunrise on Charon, the methane ice desorbs, leaving behind the photolytic ethane at a low surface coverage. As temperatures rise toward 60 K during the peak summer period, we expect this residual ethane to undergo thermal diffusion and clustering, consistent with our measurements, despite potential differences in the initial microstructure.
Specular reflectance spectra in the UV-Vis-NIR (λ = 190 − 1100 nm) were acquired using an Ocean Optics Maya2000 Pro dispersive grating-based spectrometer with a deuterium-halogen illumination source at a 2.5° incidence. Reflectance, R(λ), was obtained by dividing the measured reflected signal of the ice by the signal from the bare gold QCM. Infrared spectral coverage (1.1–16 μm, 2 cm−1 resolution) was obtained at a 35° incidence using a Thermo-Nicolet is50 Fourier transform infrared spectrometer (selected infrared spectra from our experiments are shown in Fig. A.2). Visible images of the QCM surface, illuminated by the deuterium-halogen lamp at a 22.5° incidence, were captured with a Teledyne Infinity 8-8C CMOS camera and a KF InfiniMax long distance microscopy lens. These images were obtained in the direction of specular reflectance at a 45° phase angle.
For independent verification, additional experiments were carried out at the Lowell Observatory-Northern Arizona University Astrophysical Materials Laboratory using a similar protocol. Ethane ice films of ∼100 ML were deposited and held at 62 K while acquiring UV-Vis-NIR spectra at a 45° incidence with an Avantes AvaSpec-ULS2048XL-EVO spectrometer and AvaLight-DHS deuterium-halogen source. The results from these experiments are shown in Fig. A.3.
3. Results
The ethane-coated water ice films were also annealed at several temperatures between 55 and 62 K, which revealed a strong temperature dependence on the reddening rate. Representative reflectance spectra for ∼200 ML ethane ice deposited atop a ∼1000 ML water ice layer following thermal annealing for ∼210 minutes at 55 K and 60 K are shown in Figs. 1A and 1D, respectively. The spectra exhibit intensity maxima and minima – interference fringes – arising from light reflected at the ethane-vacuum, water-ethane, and water-gold interfaces (Teolis et al. 2007; Raut et al. 2008). Notably, substantial reduction in reflectance below 1000 nm was observed in the film held at 60 K for 3.5 h. The oscillations shifted downward while the amplitude of the fringes also diminished with annealing time. In contrast, this reddening effect is mostly absent at 55 K. At 60 K, the ice undergoes rapid reddening with reflectance below 300 nm, decreasing by more than 50% within 120 min of annealing time. Through the corresponding QCM images, we were able to visually confirm these trends. Specifically, no discernible color change occurs at 55 K (Figs. 1B and 1C), whereas pronounced reddening is evident in the 60 K ice following 210 minutes (Fig. 1F compared to 1E). Upon further warming, ethane rapidly desorbs, leaving behind water ice by 100 K in its original color, similar to 1E.
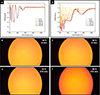 |
Fig. 1. (A) Specular reflectance spectra of a 200 ML ethane film atop a 1000 ML water ice at 55 K, recorded over time during 3.5 hours (210 minutes) of annealing. The image displays minimal spectral change. (B, C) QCM images of the ethane–water ice layer at 55 K at 0 and 210 minutes, respectively. These images show no visible color transition. (D) Time-series reflectance spectra at 60 K showing pronounced reddening within 3.5 hours. (E, F) Corresponding QCM images at 60 K at 0 and 210 minutes, respectively. These images clearly illustrate the thermal reddening of the ethane-coated ice. |
To quantify this temperature dependence of the reddening rate, we monitored the decrease in reflectance at multiple λ < 350 nm over time at each temperature. In Fig. 2 we plot τ50 – the time required for the reflectance at a given wavelength to fall to 50% of the initial value – against the annealing temperature. The inset plot of Fig. 2 highlights that the reddening accelerates rapidly with temperature. For instance, at 60 K, τ50 for 247 nm is ∼70 min, but lowering the temperature by just 1K more than doubles τ50 to ∼160 min. Generally, we observed that the longer wavelengths redden more slowly than the shorter wavelengths. At 60 K, τ50 for 340 nm is ∼140 minutes, starkly increasing to 176 minutes when the temperature is lowered to just 59.5 K.
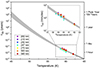 |
Fig. 2. Time required for the reflectance of solid ethane at wavelengths shorter than 400 nm to decrease by 50% (τ50) as a function of temperature. Circular symbols represent experimental measurements between 57.5 K and 62 K at selected wavelengths in the reflectance spectra. The shaded region indicates the range of reddening timescales – bounded by the maximum and minimum values derived from Arrhenius fits across all measured wavelengths. The strong temperature dependence implies that reddening becomes progressively slower at lower temperatures, extending to century-long timescales near 45 K. |
4. Discussion and implications for Charon
To estimate the experimental reddening timescales at the lower temperatures typical of Charon’s spring surface (∼40 K), we fit the experimental τ50 versus temperature data for various λ in Fig. 2 with an Arrhenius function of the form
Here, Er is the activation barrier energy for thermal reddening, k is the Boltzmann constant, and T is the annealing temperature. The preexponential term τ0 encompasses the vibrational and collisional timescales and geometric factors specific to thermal or diffusion-activated restructuring of ethane films. The shaded area indicates the range (maximum and minimum bounds) of the reddening timescales based on fits across all measured wavelengths. The fit to the data constrains the reddening activation energy: Er = 0.205 ± 0.01 eV. The exponential dependence of the reddening timescale on temperature means that at 45 K, the reddening progresses over centuries – comparable to half a Pluto-Charon orbital year.
The thermal reddening of ethane ice may be driven by gradual aggregation of ethane molecules into nanoscale clusters, possibly tens to hundreds of nanometers in size. As the temperature increases, diffusion enables the molecules to migrate and coalesce, and they form discrete clusters that act as efficient scatterers of shorter wavelength light to impart the redder hue to the ice. Such island-type clustering is thermodynamically favorable compared to extended films, as it minimizes the overall surface energy of the system. Similar diffusion-driven agglomeration of thin films into 3D islands has also been reported for metal and organics layers on metallic substrates (Altomare et al. 2016; Pahlavan et al. 2018). Ethane’s hydrophobicity likely promotes clustering as a means to avoid contact with the underlying water ice (Wu & Prausnitz 2008; Grdadolnik et al. 2017). However, similar reddening effects were also observed when ethane was deposited directly onto the bare gold substrate, suggesting clustering and associated reddening are not exclusive to the C2H6-H2O ice system. In the Lowell observatory experiments (Fig. A.3), ethane films on bare gold substrate reddened rapidly at 62 K, with an ∼43% reduction in reflectance at ∼300 nm occurring in only about 28 min, a rate that can be extrapolated to a likely 50% reduction after 33 min.
As temperatures approach 60 K, sublimation becomes a competing process that likely limits the size of the nanoclusters. We measured a sublimation rate of ∼8 × 10⁻³ ML s−1 at 60 K. Notably, the activation energy for thermal reddening derived from the Arrhenius fits are close to the sublimation energy of ethane ice, Es = 0.215 eV (Smith et al. 2016), implying co-occurrence of these processes. At lower temperatures, both nanoclustering and sublimation slow markedly, but reddening progresses marginally faster, owing to a smaller barrier against surface diffusion than sublimation. Consequently, even limited molecular mobility allows ethane molecules to diffuse short distances and aggregate into optically scattering nanoclusters before significant volatile loss. In addition, impinging solar wind acts on the nanoclusters, primarily radiolyzing the ethane nanoclusters into globules of higher-order organic refractories. Although Charon’s polar regions can reach ∼60 K, leading to rapid desorption of ethane, most of the ∼30-year spring period is spent at temperatures below 50 K, where ethane ice remains stable (Teolis et al. 2022). During this period, ongoing solar wind radiolysis converts thermally reddened ethane clusters into possibly optically red and less volatile tholin clusters, which are stable at 60 K and may contribute to the north polar region’s red hue (Grundy et al. 2016a).
Surprisingly, recent JWST disk-averaged observations of Charon that included the coverage of the northern red polar region revealed no detectable signatures of ethane or complex organics (Protopapa et al. 2024), suggesting abundances below detection limits. Nevertheless, trace concentrations of such organics, particularly if present as nanoclusters, could modify Charon’s distinctive reddish polar hue, potentially reducing it during late spring as the residual ethane warms and its texture evolves to preferentially scatter blue light. Notably, Protopapa et al. (2024) reported a clear detection of CO2 on Charon’s surface. The processing of hydrocarbons in the presence of water ice by energetic agents – such as interplanetary medium and solar Lyman-α and UV photons, solar wind, and galactic cosmic rays – could plausibly yield a fraction of the observed CO2. The accompanying detection of hydrogen peroxide provides further evidence of active, ongoing radiolytic or photolytic processing of Charon’s surface driven by exposure to energetic photons and particles.
The experimental evidence of thermal reddening via nanocluster formation identifies a new physical process that may take place on Charon’s polar zones. Our results suggest that ethane exposed to warmer springtime temperatures can diffuse and coalesce into nanoscale aggregates that preferentially scatter shorter wavelengths. Thermal nanocluster aggregation may not be unique to ethane but could also occur with volatiles – such as CO, CO2 CH4, and O2 – capable of diffusing and coalescing prior to sublimation. The combined effects of thermal nanoclustering and surface radiolysis may offer a unifying framework for understanding the state of red material on Charon’s poles and, potentially, on other volatile-bearing colorful objects in the outer Solar System, including Titan, Triton, Pluto, Arrokoth, Eris, Makemake, and many others.
Acknowledgments
Funding for this work was provided by the NASA Future Investigators in Earth and Space Science and Technology program grant 80NSSC22K1370. Support was also provided by NASA New Frontiers Data Analysis Program grants 80NSSC18K1391 and 80NSSC22K1036. Thanks to Josh Brody, Bereket Mamo, Brandon Perez, and Danna Qasim for their technical assistance with the Mordor instrumentation suite.
References
- Allodi, M. A., Baragiola, R. A., Baratta, G. A., et al. 2013, Space Sci. Rev., 180, 101 [Google Scholar]
- Altomare, M., Nguyen, N. T., & Schmuki, P. 2016, Chem. Sci., 7, 6865 [Google Scholar]
- Gladstone, G. R., Pryor, W. R., & Alan Stern, S. 2015, Icarus, 246, 279 [NASA ADS] [CrossRef] [Google Scholar]
- Grdadolnik, J., Merzel, F., & Avbelj, F. 2017, PNAS, 114, 322 [Google Scholar]
- Grundy, W. M., Binzel, R. P., Buratti, B. J., et al. 2016a, Science, 351, aad9189 [NASA ADS] [CrossRef] [Google Scholar]
- Grundy, W. M., Cruikshank, D. P., Gladstone, G. R., et al. 2016b, Nature, 539, 65 [Google Scholar]
- Hudson, R. L., Moore, M. H., & Raines, L. L. 2009, Icarus, 203, 677 [Google Scholar]
- Hudson, R., Gerakines, P., & Moore, M. 2014, Icarus, 243, 148 [NASA ADS] [CrossRef] [Google Scholar]
- Khare, B., Thompson, W., Sagan, C., Arakawa, E., & Lawn, J. 1990, BAAS, 22, 1033 [Google Scholar]
- Mitchell, E. H., Raut, U., Teolis, B. D., & Baragiola, R. A. 2017, Icarus, 285, 291 [NASA ADS] [CrossRef] [Google Scholar]
- Pahlavan, A. A., Cueto-Felgueroso, L., Hosoi, A. E., McKinley, G. H., & Juanes, R. 2018, J. Fluid Mech., 845, 642 [Google Scholar]
- Protopapa, S., Cook, J. C., Grundy, W. M., et al. 2021, in The Pluto System After New Horizons, eds. S. A. Stern, J. M. Moore, W. M. Grundy, et al. (University of Arizona Press), 433 [Google Scholar]
- Protopapa, S., Raut, U., Wong, I., et al. 2024, Nat. Commun., 15, 8247 [Google Scholar]
- Raut, U., Famá, M., Teolis, B. D., & Baragiola, R. A. 2007, J. Chem. Phys., 127, 204713 [NASA ADS] [CrossRef] [Google Scholar]
- Raut, U., Famá, M., Loeffler, M. J., & Baragiola, R. A. 2008, ApJ, 687, 1070 [NASA ADS] [CrossRef] [Google Scholar]
- Raut, U., Teolis, B. D., Kammer, J. A., et al. 2022, Sci. Adv., 8, eabq5701 [Google Scholar]
- Smith, R. S., May, R. A., & Kay, B. D. 2016, J. Phys. Chem. B, 120, 1979 [Google Scholar]
- Stern, S. A., Bagenal, F., Ennico, K., et al. 2015, Science, 350, aad1815 [Google Scholar]
- Teolis, B. D., Loeffler, M. J., Raut, U., Famá, M., & Baragiola, R. A. 2007, Icarus, 190, 274 [Google Scholar]
- Teolis, B., Raut, U., Kammer, J. A., et al. 2022, GRL, 49, e2021GL097580 [Google Scholar]
- Wu, J., & Prausnitz, J. M. 2008, PNAS, 105, 9512 [Google Scholar]
Appendix A: Supplemental figures
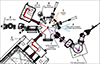 |
Fig. A.1. Schematic of the Mordor ultra-high vacuum chamber and instrumentation suite as viewed looking from above the chamber. Thin films are deposited on the cryogenically cooled QCM by controlled introduction of gasses into the chamber through dedicated dosers (3). Rotation of the QCM stage (7) allows for alignment with various instruments mounted on ports at the chamber periphery, including the UV-visible spectrometer (4) and the Fourier transform infrared (FTIR) spectrometer (2 and 5) used in this study. |
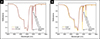 |
Fig. A.2. (A) Selected IR reflectance spectra of a 200 ML ethane film atop a 1,000 ML water ice at 55 K, recorded over time, showing minimal spectral change in ethane absorption features (3,366 nm, 3,400 nm, and 3,473 nm) following 3.5 hours (210 minutes) of annealing. (B) At 60 K, the depth of these absorption features decreases over this time period owing to desorption of the ethane layer. The large absorption band spanning ∼ 2,800-3,300 nm corresponds to water ice. |
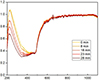 |
Fig. A.3. Ultraviolet-visible band reflectance spectra, recorded over time, of a ∼ 100 ML ethane ice film on a bare gold substrate held at 62 K. Reddening rapidly occurs at this temperature, with an ∼43% reduction in reflectance at ∼300 nm occurring in only about 28 minutes, a rate which can be extrapolated to 50% reduction after 33 minutes. These experiments were carried out at the Lowell Observatory-Northern Arizona University Astrophysical Materials Laboratory. |
All Figures
|
Fig. 1. (A) Specular reflectance spectra of a 200 ML ethane film atop a 1000 ML water ice at 55 K, recorded over time during 3.5 hours (210 minutes) of annealing. The image displays minimal spectral change. (B, C) QCM images of the ethane–water ice layer at 55 K at 0 and 210 minutes, respectively. These images show no visible color transition. (D) Time-series reflectance spectra at 60 K showing pronounced reddening within 3.5 hours. (E, F) Corresponding QCM images at 60 K at 0 and 210 minutes, respectively. These images clearly illustrate the thermal reddening of the ethane-coated ice. |
| In the text | |
|
Fig. 2. Time required for the reflectance of solid ethane at wavelengths shorter than 400 nm to decrease by 50% (τ50) as a function of temperature. Circular symbols represent experimental measurements between 57.5 K and 62 K at selected wavelengths in the reflectance spectra. The shaded region indicates the range of reddening timescales – bounded by the maximum and minimum values derived from Arrhenius fits across all measured wavelengths. The strong temperature dependence implies that reddening becomes progressively slower at lower temperatures, extending to century-long timescales near 45 K. |
| In the text | |
|
Fig. A.1. Schematic of the Mordor ultra-high vacuum chamber and instrumentation suite as viewed looking from above the chamber. Thin films are deposited on the cryogenically cooled QCM by controlled introduction of gasses into the chamber through dedicated dosers (3). Rotation of the QCM stage (7) allows for alignment with various instruments mounted on ports at the chamber periphery, including the UV-visible spectrometer (4) and the Fourier transform infrared (FTIR) spectrometer (2 and 5) used in this study. |
| In the text | |
|
Fig. A.2. (A) Selected IR reflectance spectra of a 200 ML ethane film atop a 1,000 ML water ice at 55 K, recorded over time, showing minimal spectral change in ethane absorption features (3,366 nm, 3,400 nm, and 3,473 nm) following 3.5 hours (210 minutes) of annealing. (B) At 60 K, the depth of these absorption features decreases over this time period owing to desorption of the ethane layer. The large absorption band spanning ∼ 2,800-3,300 nm corresponds to water ice. |
| In the text | |
|
Fig. A.3. Ultraviolet-visible band reflectance spectra, recorded over time, of a ∼ 100 ML ethane ice film on a bare gold substrate held at 62 K. Reddening rapidly occurs at this temperature, with an ∼43% reduction in reflectance at ∼300 nm occurring in only about 28 minutes, a rate which can be extrapolated to 50% reduction after 33 minutes. These experiments were carried out at the Lowell Observatory-Northern Arizona University Astrophysical Materials Laboratory. |
| In the text | |
Current usage metrics show cumulative count of Article Views (full-text article views including HTML views, PDF and ePub downloads, according to the available data) and Abstracts Views on Vision4Press platform.
Data correspond to usage on the plateform after 2015. The current usage metrics is available 48-96 hours after online publication and is updated daily on week days.
Initial download of the metrics may take a while.