Fig. 1.
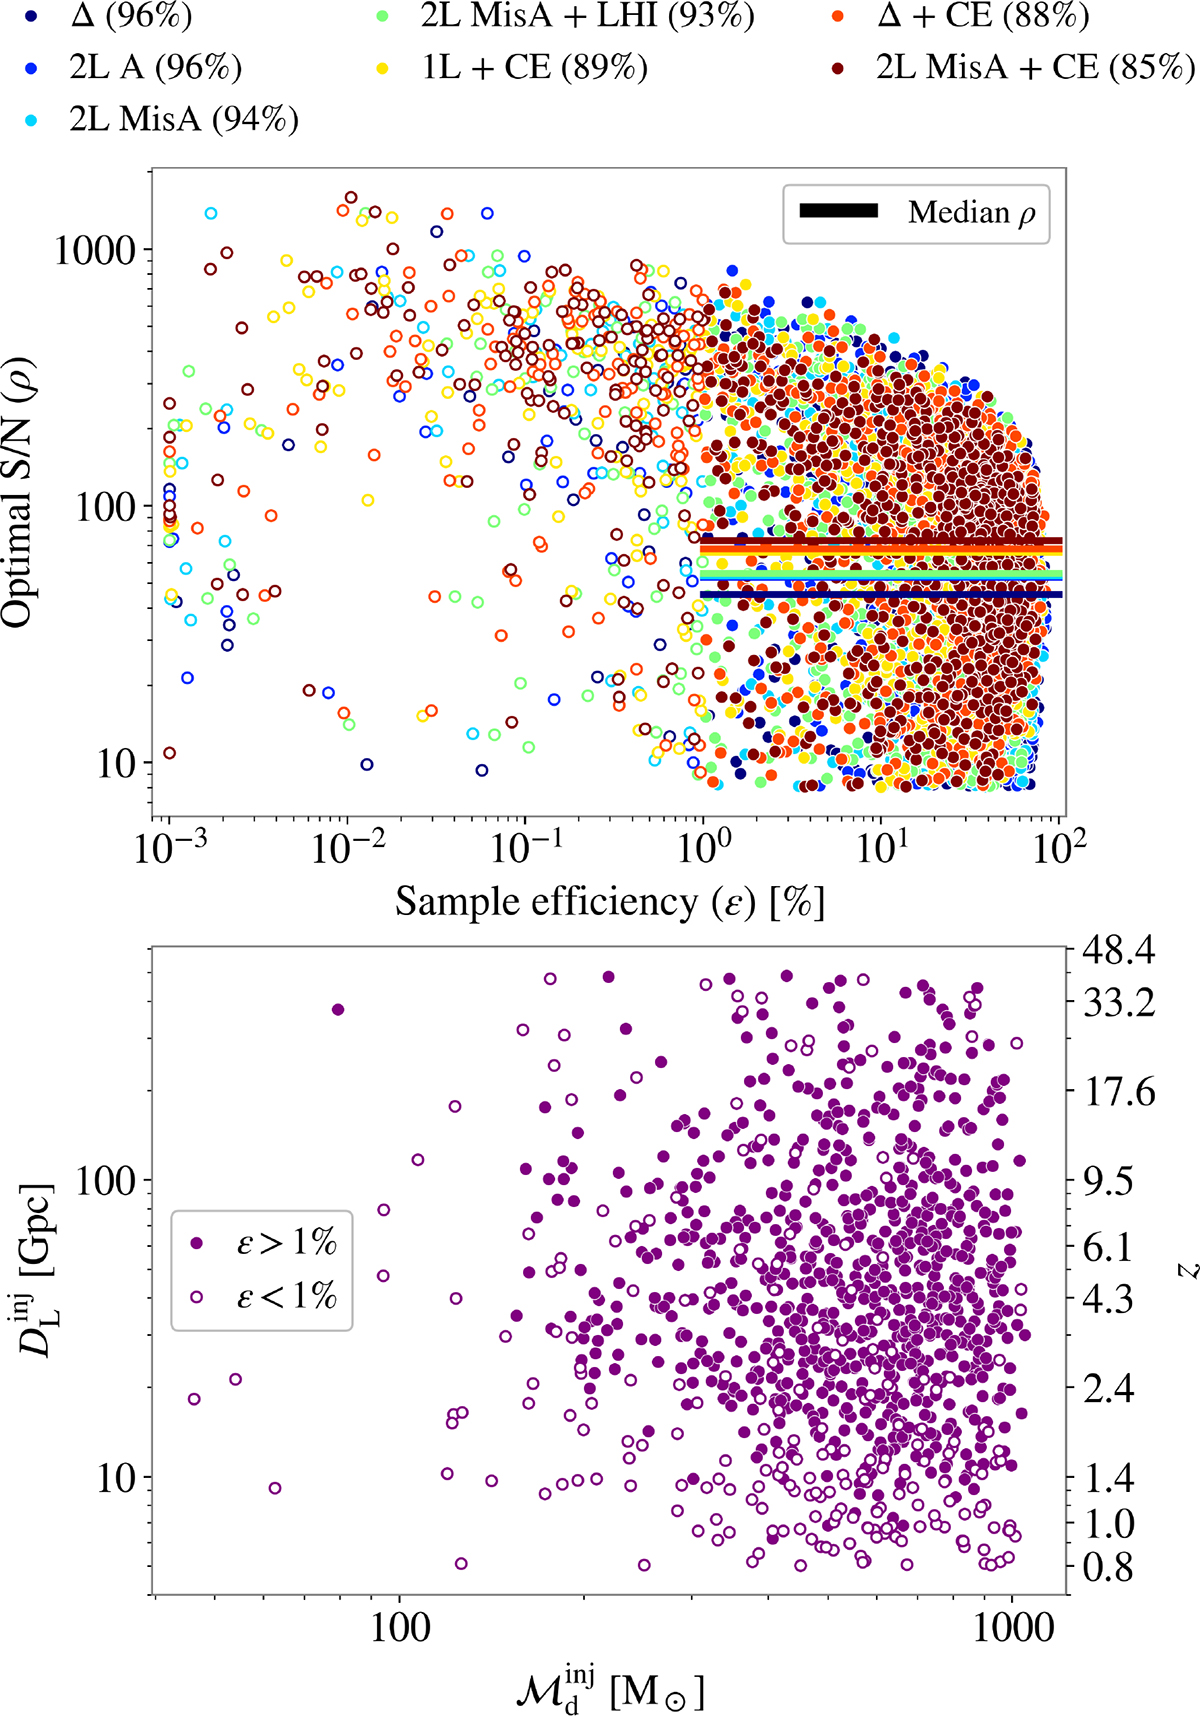
Download original image
Top panel: Injections as a function of sample efficiency (ϵ, x-axis) and optimal S/N (ρ, y-axis) for each detector configuration (color-coded). Filled markers indicate injections with sample efficiencies > 1%. Percentages in parentheses denote the fraction of sources with a sample efficiency above 1%, while the horizontal colored lines indicate the median ρ for sources exceeding this threshold. Bottom panel: Injections as a function of detector-frame chirp mass (x-axis) and luminosity distance (left y-axis), with corresponding redshifts (right y-axis). Colored markers indicate events with a sample efficiency greater than 1% in all considered detector configurations. See Sect. 3.1 for details.
Current usage metrics show cumulative count of Article Views (full-text article views including HTML views, PDF and ePub downloads, according to the available data) and Abstracts Views on Vision4Press platform.
Data correspond to usage on the plateform after 2015. The current usage metrics is available 48-96 hours after online publication and is updated daily on week days.
Initial download of the metrics may take a while.