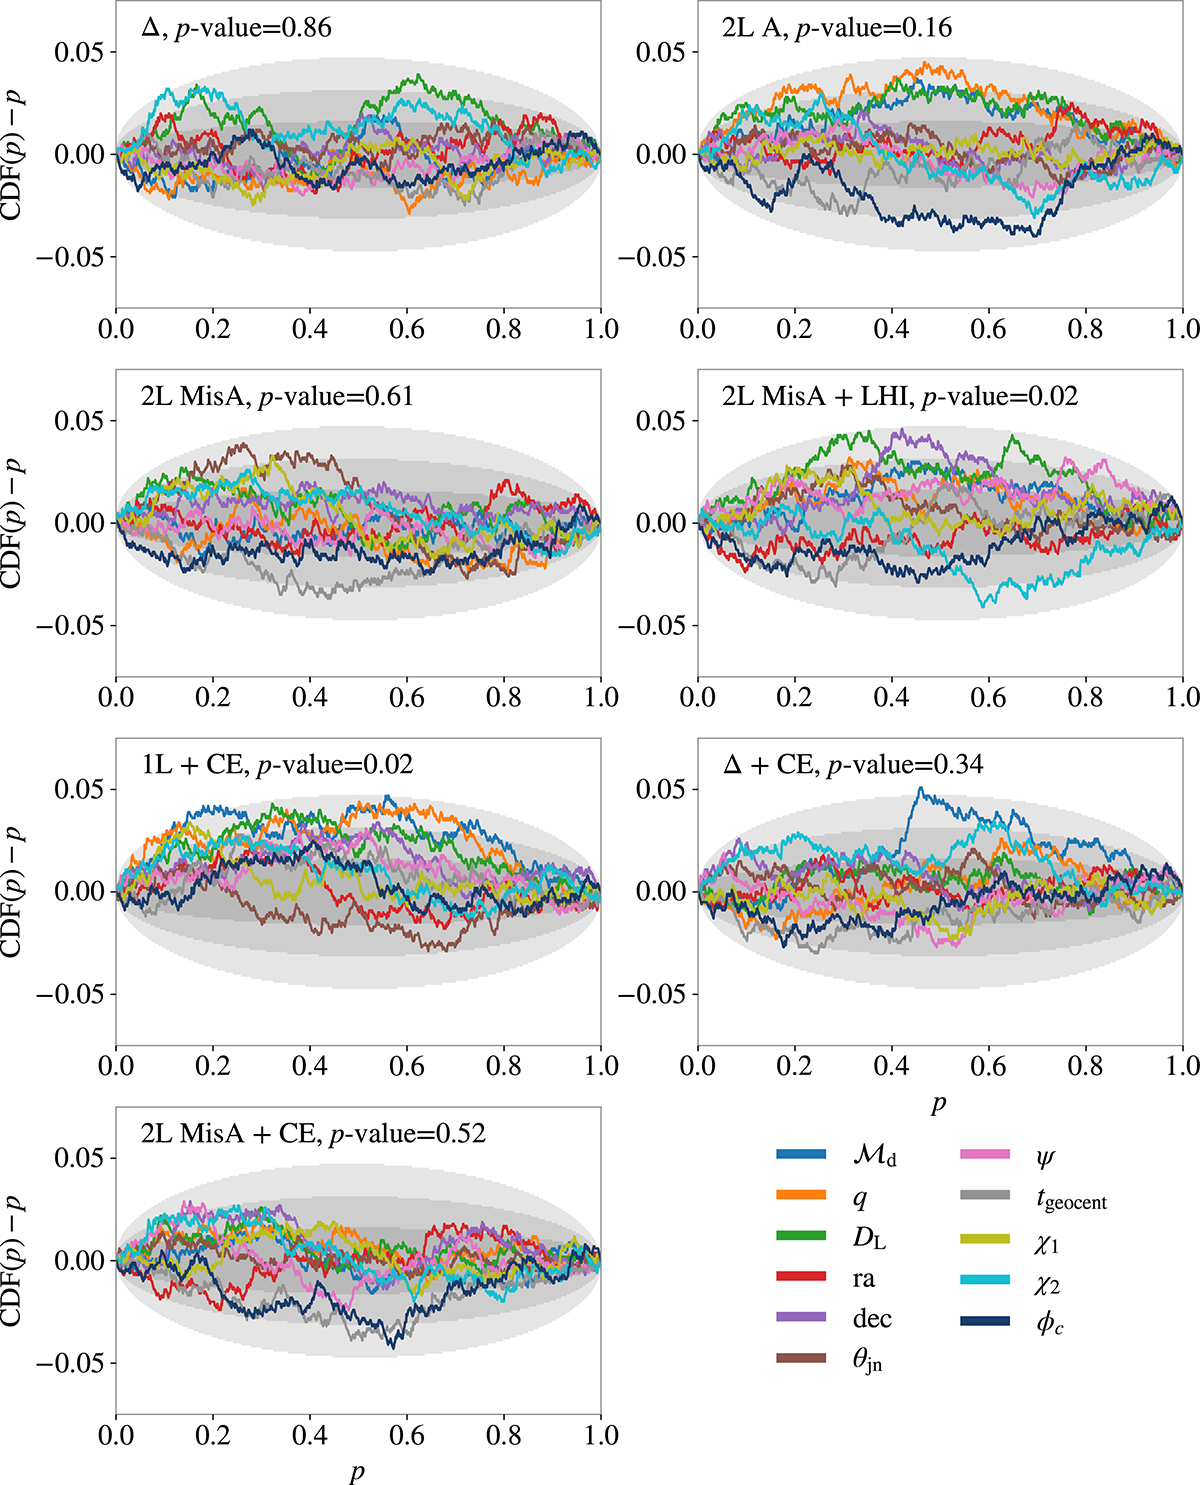
Fig. C.2.
Download original image
P–P plots showing the confidence interval (p) on the x-axis versus the difference between the observed fraction of events within that interval and the interval itself (CDF(p)−p) on the y-axis, for each GW parameter. Posteriors are obtained with DINGO (without importance sampling) from 1000 injected BBH signals sampled from the prior (Table B1) for all the considered detector configurations. Shaded regions denote the 1σ, 2σ, and 3σ confidence intervals, with combined p-values shown in the top-left corner of each panel. Individual p-values for each parameter and configuration are reported in Table C.1. See Appendix C for further details.
Current usage metrics show cumulative count of Article Views (full-text article views including HTML views, PDF and ePub downloads, according to the available data) and Abstracts Views on Vision4Press platform.
Data correspond to usage on the plateform after 2015. The current usage metrics is available 48-96 hours after online publication and is updated daily on week days.
Initial download of the metrics may take a while.