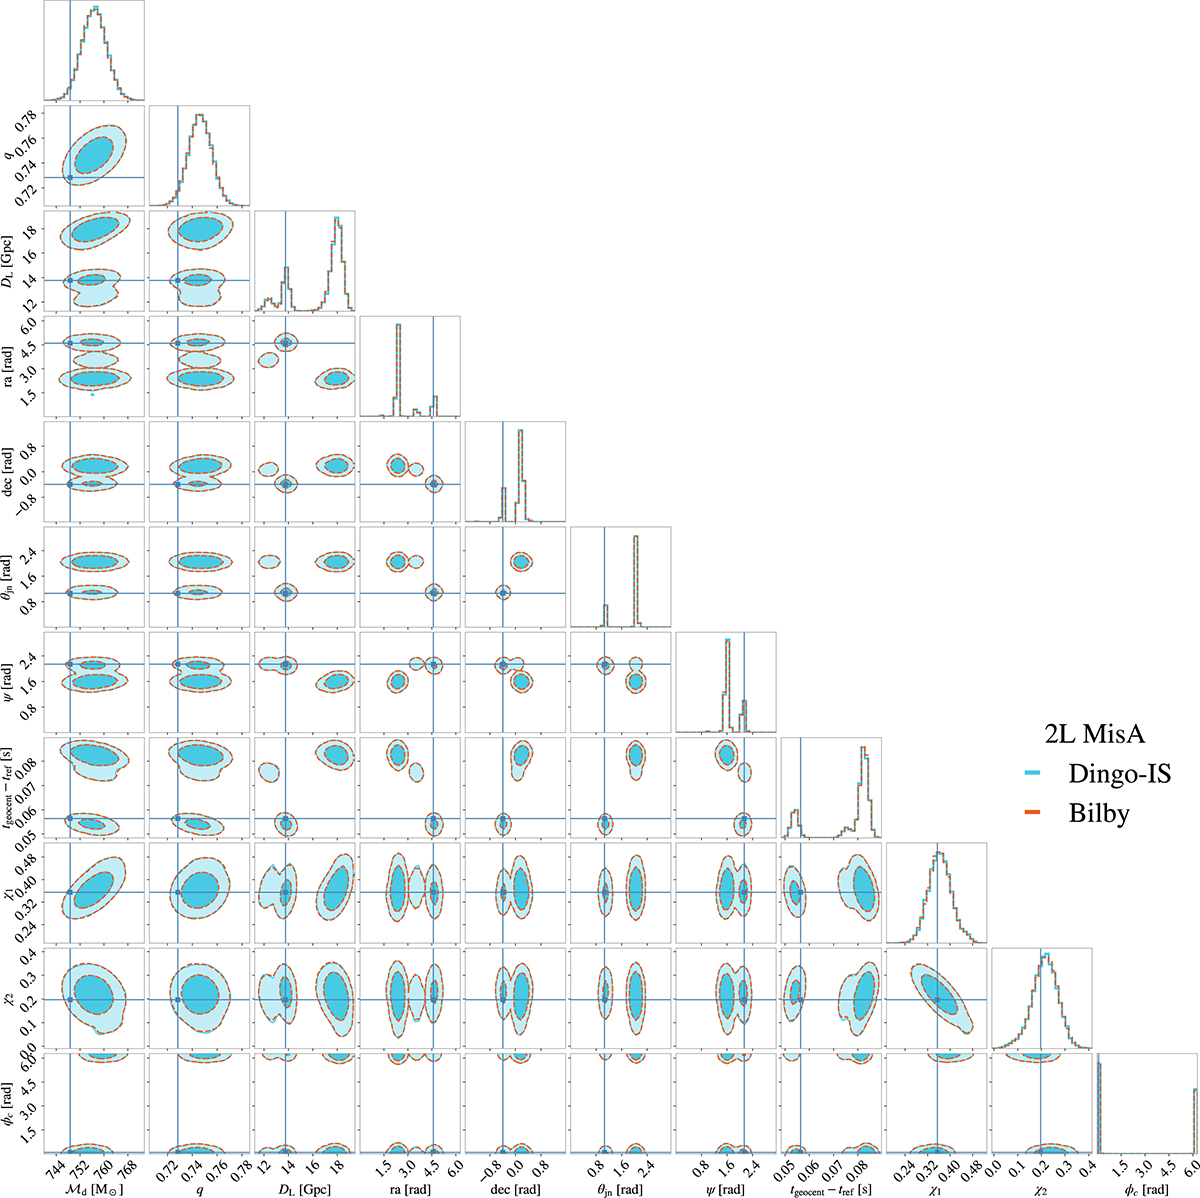
Fig. D.1.
Download original image
Marginalized one- and two-dimensional posterior distributions for all parameters for the event shown in Fig. 2 observed with the 2L MisA configuration. Results from DINGO-IS (light blue) are compared with BILBY (orange). Vertical and horizontal lines indicate the true injected values (see Table D.1) and contours represent the 68% and 95% credible regions. See Appendix D for further details.
Current usage metrics show cumulative count of Article Views (full-text article views including HTML views, PDF and ePub downloads, according to the available data) and Abstracts Views on Vision4Press platform.
Data correspond to usage on the plateform after 2015. The current usage metrics is available 48-96 hours after online publication and is updated daily on week days.
Initial download of the metrics may take a while.