Fig. 2
Download original image
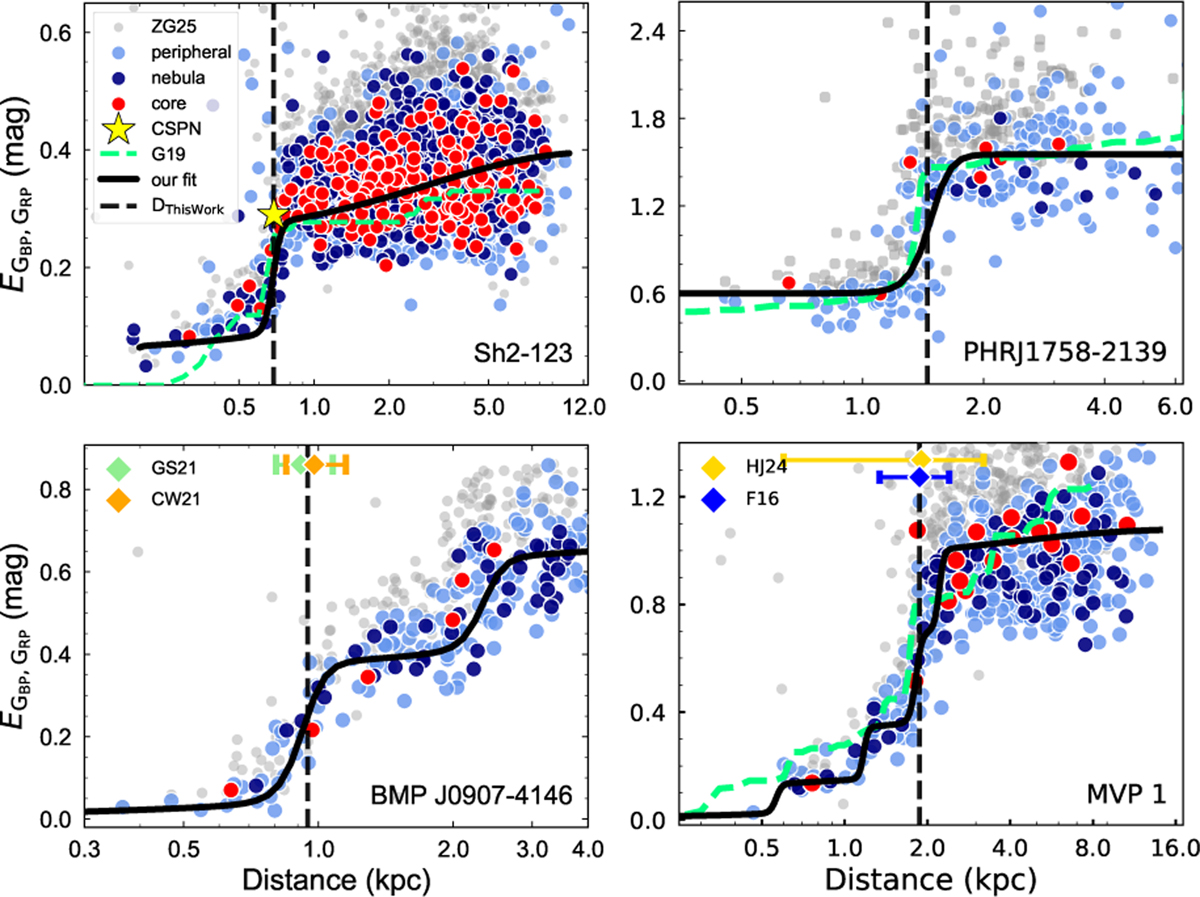
Extinction–distance profiles for four PNe with single jumps in the top row and multiple jumps in the bottom row. PN names are labelled at the lower right of each panel. Distance (in kiloparsec) vs extinction EGBP,GRP (in magnitude). The source colours are the same as those in Figure 1, and the solid black lines show the fits obtained with our extinction-jump model. PN positions are shown with vertical dashed black lines. The grey points represent ZG25 stars, and the dashed green lines indicate G19 curves. PN distance constraints are shown as diamonds with error bars from GS21 (light green), CW21 (orange), HJ24 (yellow), and F16 (blue). Conventions are consistent throughout.
Current usage metrics show cumulative count of Article Views (full-text article views including HTML views, PDF and ePub downloads, according to the available data) and Abstracts Views on Vision4Press platform.
Data correspond to usage on the plateform after 2015. The current usage metrics is available 48-96 hours after online publication and is updated daily on week days.
Initial download of the metrics may take a while.