Fig. 3
Download original image
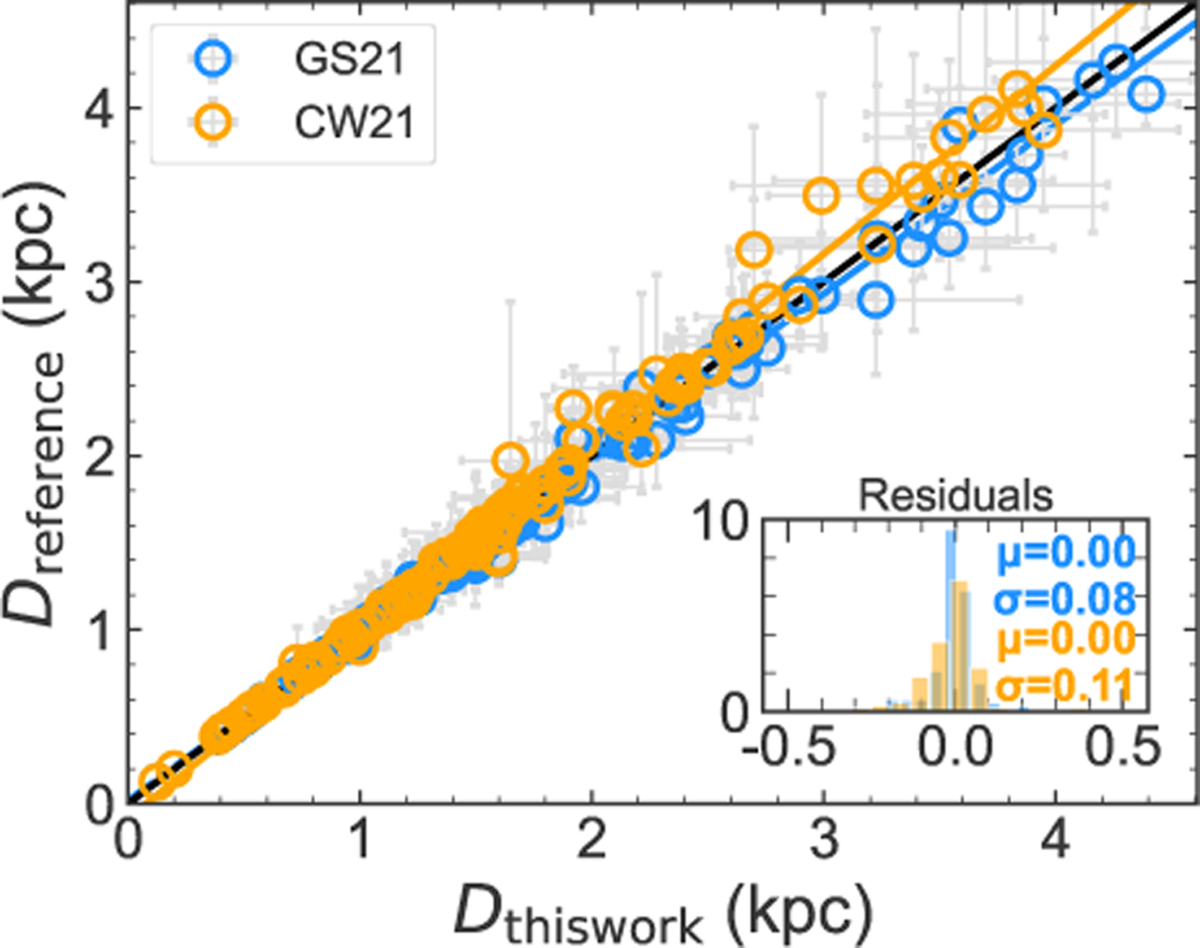
Comparison of distances for the tight sample. Distances derived in this work are compared with those from CW21 (orange circles) and GS21 (blue circles). All data points are shown with their associated uncertainties. The solid black line shows y = x, while the coloured lines represent the best-fitting relations. The inset displays the distribution of residuals.
Current usage metrics show cumulative count of Article Views (full-text article views including HTML views, PDF and ePub downloads, according to the available data) and Abstracts Views on Vision4Press platform.
Data correspond to usage on the plateform after 2015. The current usage metrics is available 48-96 hours after online publication and is updated daily on week days.
Initial download of the metrics may take a while.