Fig. 6
Download original image
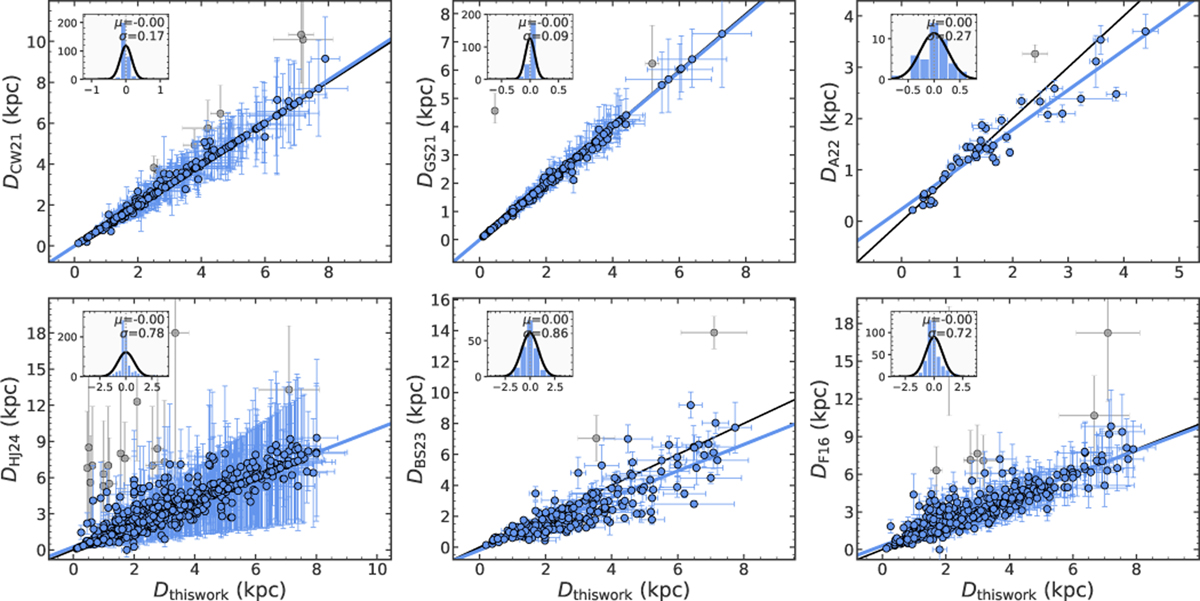
Comparison of our distances (x-axis, kiloparsec) with literature values (y-axis, kiloparsec). Each panel shows a reference scale (CW21, GS21, F16, A22, BS23, and HJ24). The solid black line shows y = x, and the coloured lines represent orthogonal linear fits obtained with iterative 3σ rejection for each dataset. The grey points indicate the objects excluded (>3σ) from the final fit. The insets show the residual distributions with the mean (μ) and scatter (σ).
Current usage metrics show cumulative count of Article Views (full-text article views including HTML views, PDF and ePub downloads, according to the available data) and Abstracts Views on Vision4Press platform.
Data correspond to usage on the plateform after 2015. The current usage metrics is available 48-96 hours after online publication and is updated daily on week days.
Initial download of the metrics may take a while.