Open Access
Fig. 8
Download original image
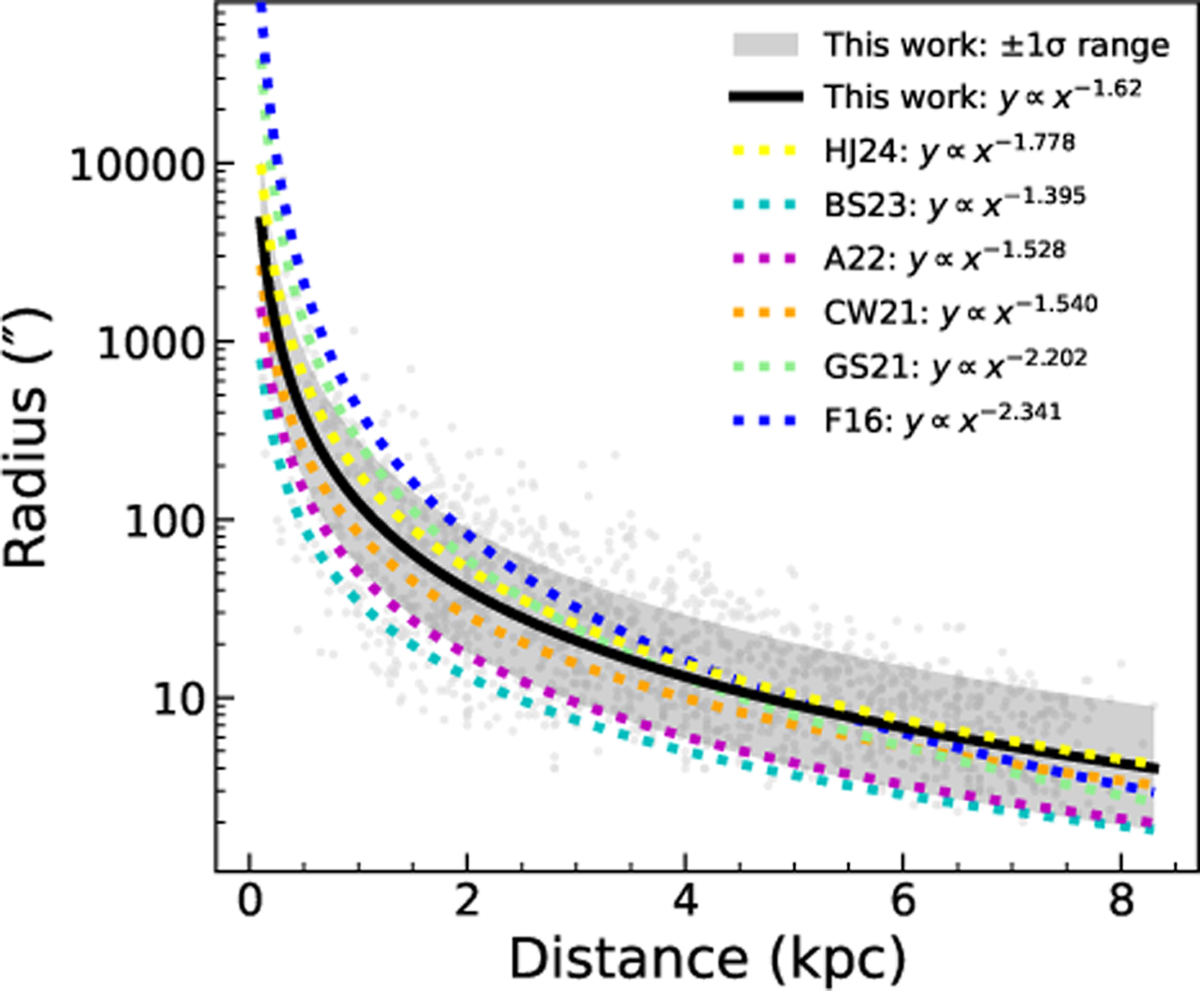
Comparison of fitted RPN–distance relations. The grey points indicate our PNe. The black line and shaded area show our best fit and the 1σ range. The dashed coloured lines represent literature fits obtained from their original complete datasets, using the same colour coding as in Figure 2.
Current usage metrics show cumulative count of Article Views (full-text article views including HTML views, PDF and ePub downloads, according to the available data) and Abstracts Views on Vision4Press platform.
Data correspond to usage on the plateform after 2015. The current usage metrics is available 48-96 hours after online publication and is updated daily on week days.
Initial download of the metrics may take a while.