Fig. 9
Download original image
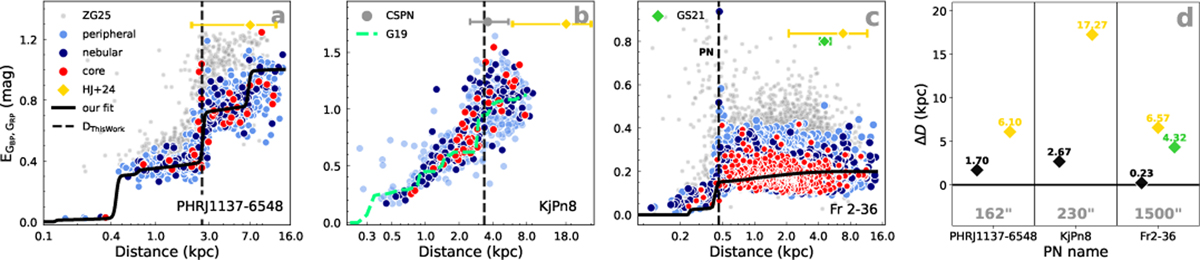
Panels (a–c): extinction–distance profiles for three PNe, with names labelled at the lower right. Sources and lines are colour-coded, as in Figure 2. Panel (d): residuals ΔD = D − DRfit, where DRfit is the distance predicted by the RPN–distance fit for each PN. PN names are listed along the x-axis, with the adopted literature value of RPN indicated below each PN. The data points adopt the colours from panels (a) to (c), with our determinations highlighted as black diamonds. All residuals are labelled above their respective points.
Current usage metrics show cumulative count of Article Views (full-text article views including HTML views, PDF and ePub downloads, according to the available data) and Abstracts Views on Vision4Press platform.
Data correspond to usage on the plateform after 2015. The current usage metrics is available 48-96 hours after online publication and is updated daily on week days.
Initial download of the metrics may take a while.