Open Access
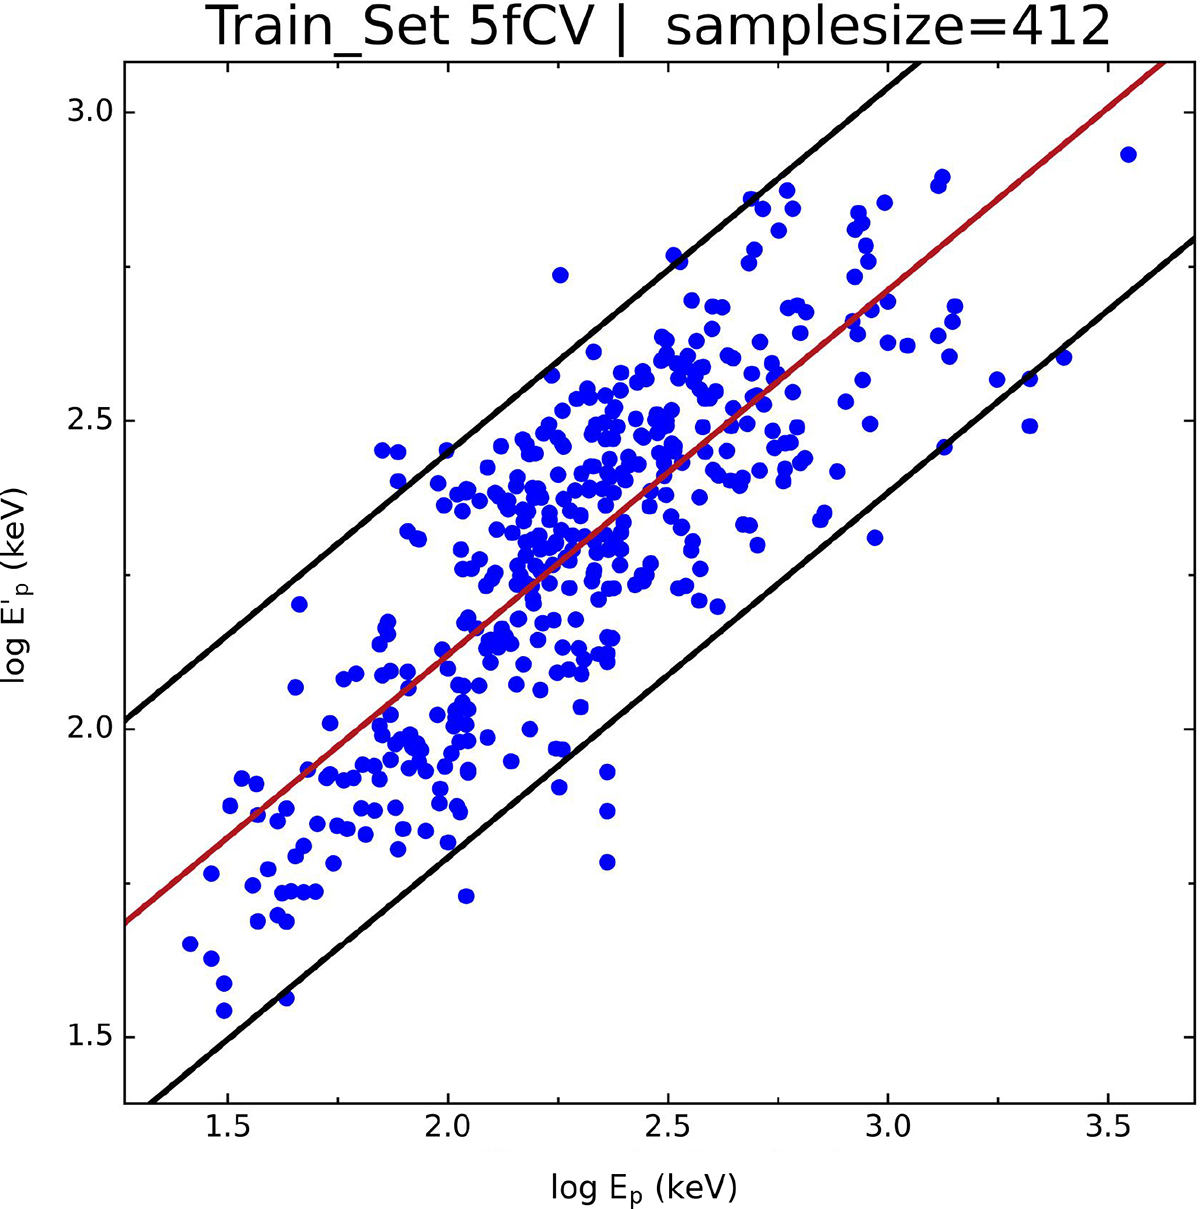
Fig. 7.
Download original image
Relation between the estimated peak energy (E′p) obtained with the SuperLearner model and the observed peak energy (Ep) for the training set. The solid red line shows the best-fit relation, while the solid black lines mark the 2σ confidence bounds.
Current usage metrics show cumulative count of Article Views (full-text article views including HTML views, PDF and ePub downloads, according to the available data) and Abstracts Views on Vision4Press platform.
Data correspond to usage on the plateform after 2015. The current usage metrics is available 48-96 hours after online publication and is updated daily on week days.
Initial download of the metrics may take a while.