Fig. 1
Download original image
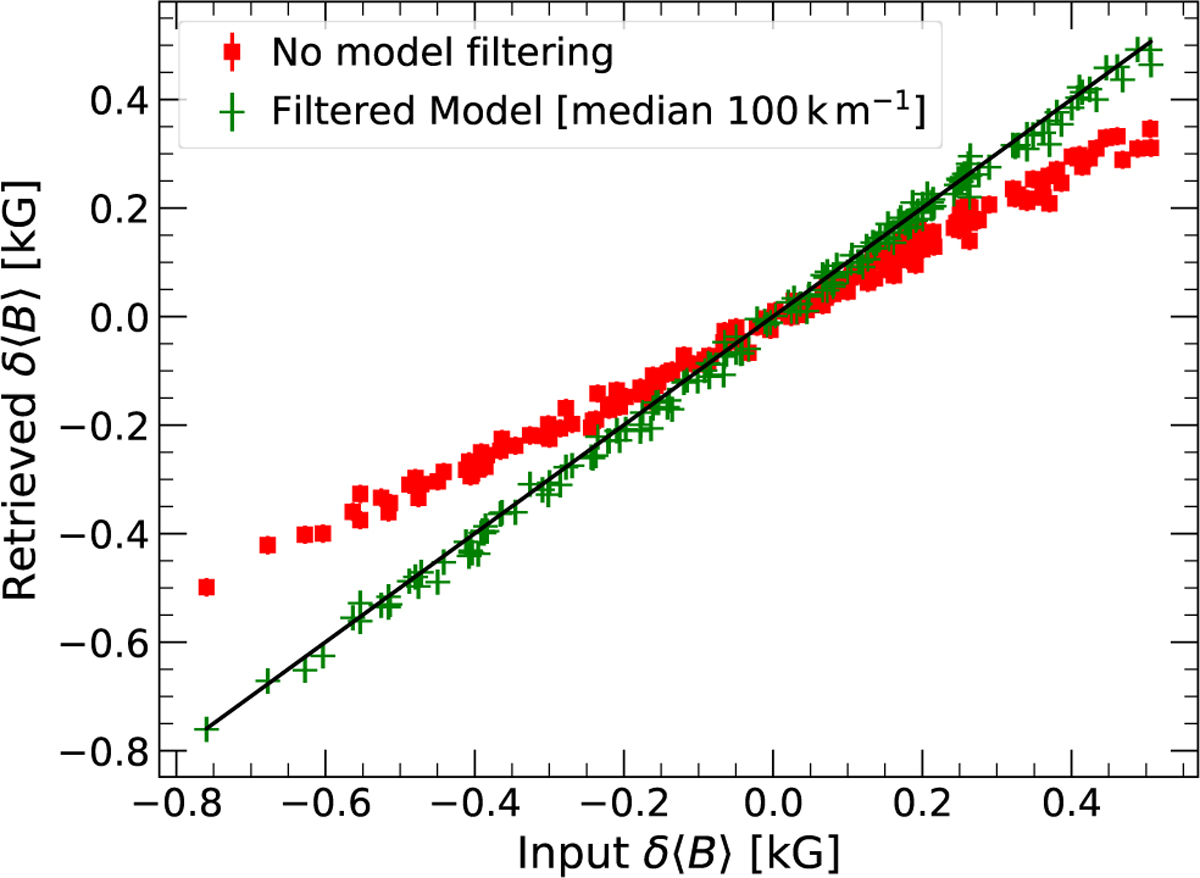
Comparison between the retrieved (y-axis) and input (x-axis) relative magnetic field strengths (δ〈B〉). The synthetic observations were normalized to the template using a rolling median with a window of 100km s−1. The red squares and green plus symbols (‘+’) show the results obtained before and after re-normalizing the models used to computed Fk - F0 (Eq. (4)) with a 100 km s−1 median filter, respectively (see text). The black line marks the equality. This figure illustrates the need for careful re-normalization of the models to avoid biases in the results.
Current usage metrics show cumulative count of Article Views (full-text article views including HTML views, PDF and ePub downloads, according to the available data) and Abstracts Views on Vision4Press platform.
Data correspond to usage on the plateform after 2015. The current usage metrics is available 48-96 hours after online publication and is updated daily on week days.
Initial download of the metrics may take a while.