Fig. 2
Download original image
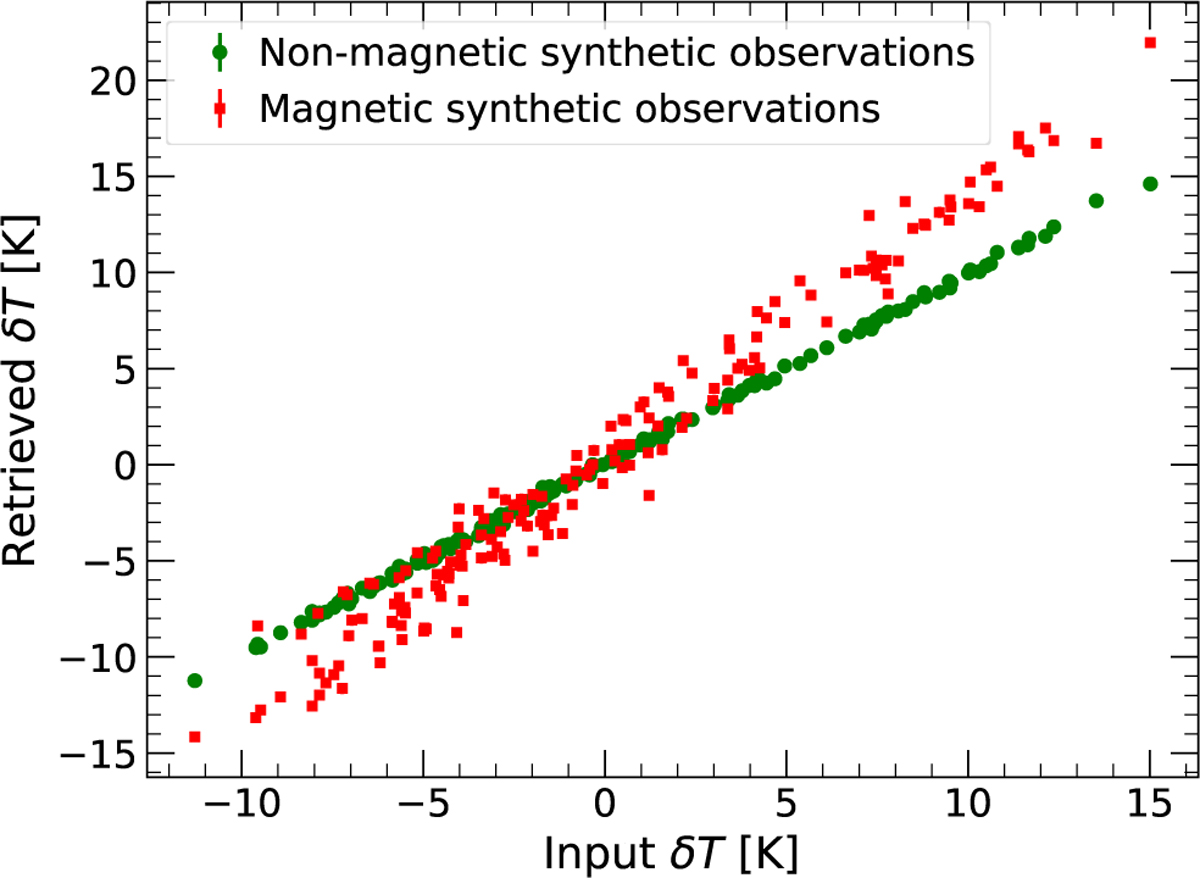
Comparison between the retrieved δT (y-axis) and the input δT used to generate the synthetic observations (x-axis). Synthetic observations were computed on the wavelength range covered by Narval/ESPaDOnS, accounting for magnetic field variations (red squares), or fixing the value of the magnetic fields to 0 kG (green circles). This figure illustrates how magnetic fields can impact the δT estimates.
Current usage metrics show cumulative count of Article Views (full-text article views including HTML views, PDF and ePub downloads, according to the available data) and Abstracts Views on Vision4Press platform.
Data correspond to usage on the plateform after 2015. The current usage metrics is available 48-96 hours after online publication and is updated daily on week days.
Initial download of the metrics may take a while.