Fig. 3
Download original image
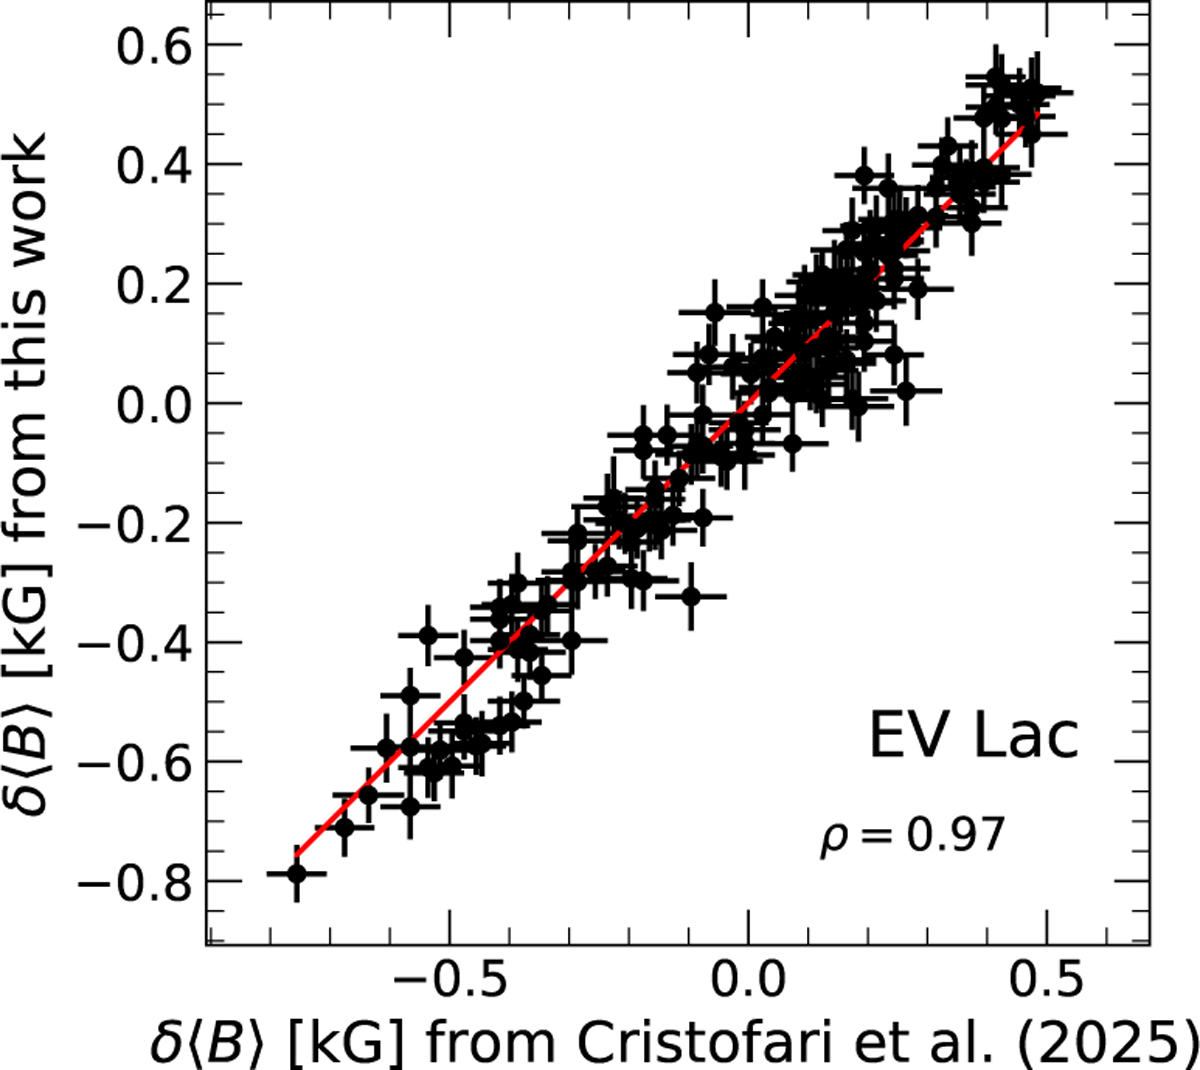
Comparison between δ〈B〉 obtained in this work and the values of Cristofari et al. (2025). The average 〈B〉 was removed from the estimates of Cristofari et al. (2025) for comparison. The red line shows the equality. The Pearson correlation coefficient (ρ) is shown on the figure. Our process allows us to retrieve δ〈B〉 values that are in very good agreement with those obtained from fits of synthetic spectra to the data.
Current usage metrics show cumulative count of Article Views (full-text article views including HTML views, PDF and ePub downloads, according to the available data) and Abstracts Views on Vision4Press platform.
Data correspond to usage on the plateform after 2015. The current usage metrics is available 48-96 hours after online publication and is updated daily on week days.
Initial download of the metrics may take a while.