Fig. 8.
Download original image
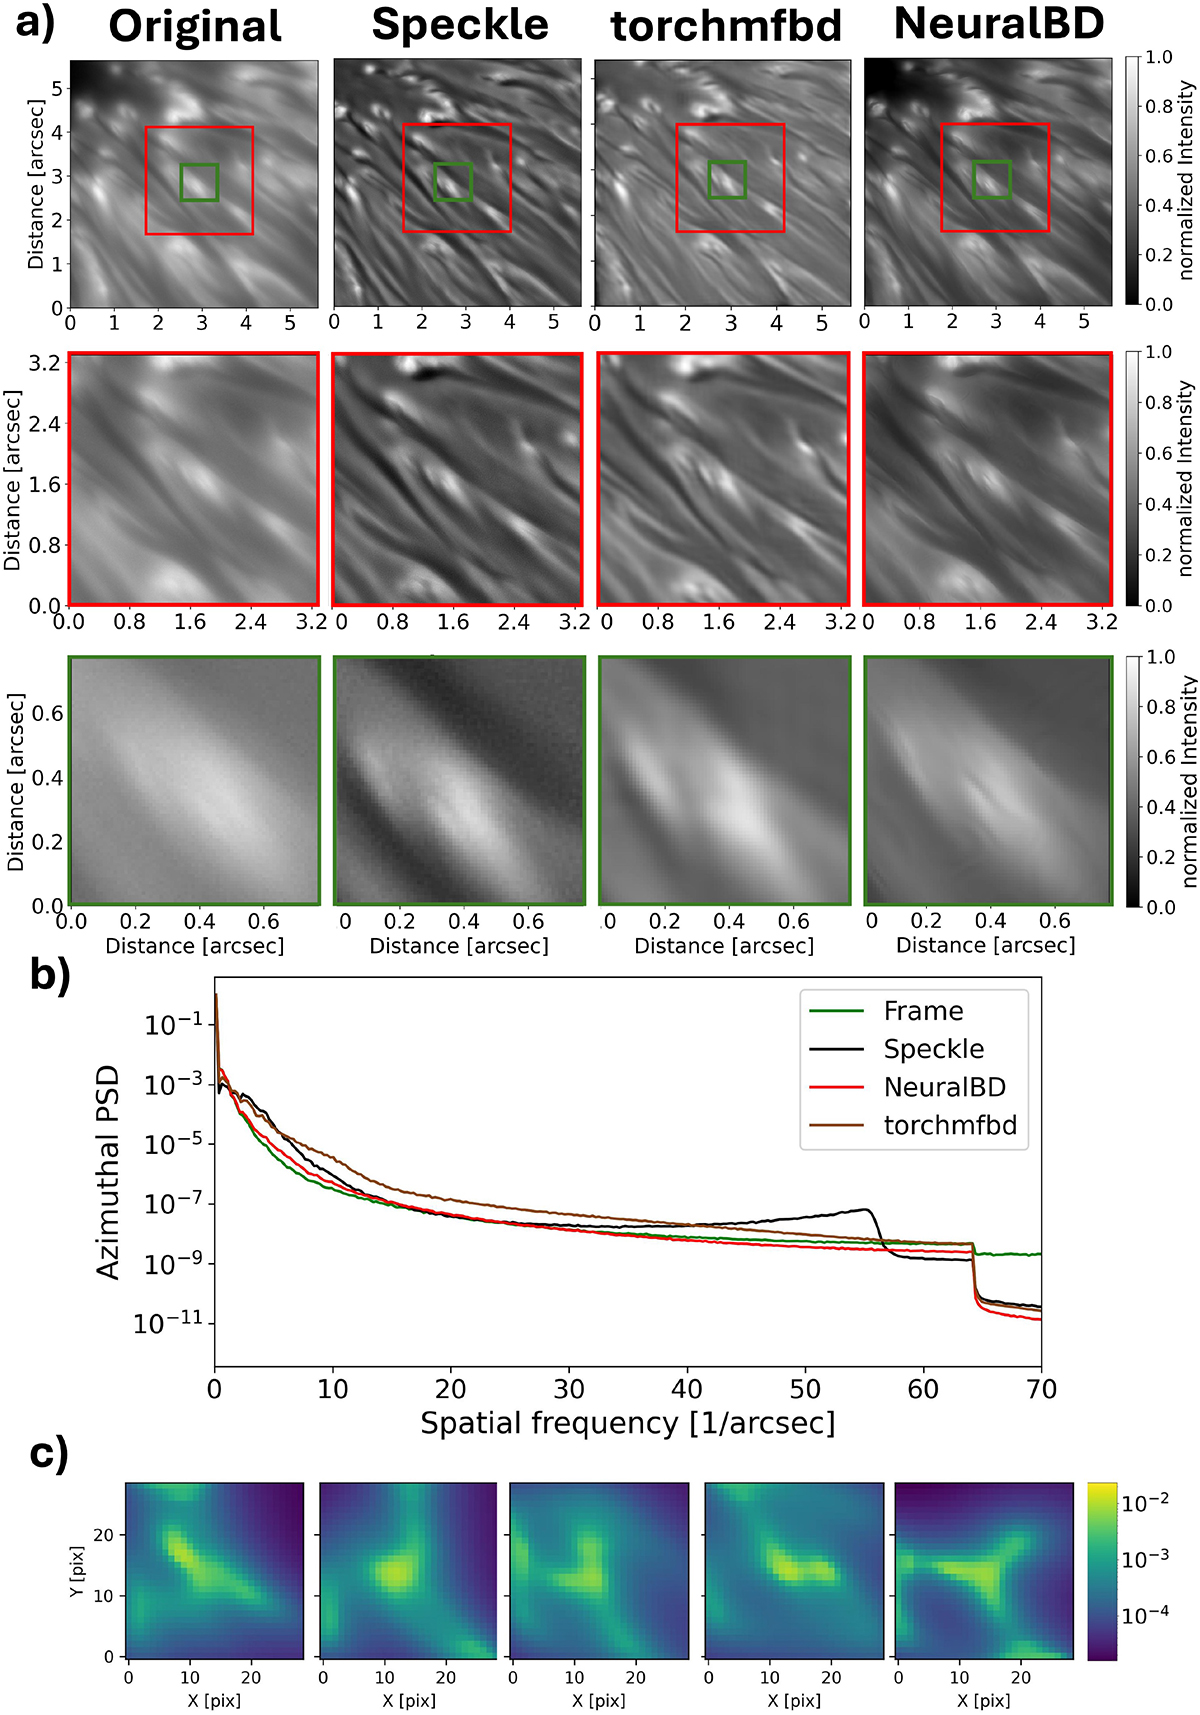
Comparison of reconstruction methods with NeuralBD, torchmfbd, and speckle. (a) Single frame of the original burst (first column), the speckle reconstruction (second column), the torchmfbd reconstruction (third column), and the NeuralBD reconstruction (fourth column). The red and green boxes show zoomed-in views of the regions on smaller spatial scales. (b) The azimuthal power spectra are shown, where the green line corresponds to the single frame of the burst, black to the speckle reconstruction, brown to the torchmfbd reconstruction, and red to the NeuralBD reconstruction. (c) Five example PSFs estimated by the NeuralBD method.
Current usage metrics show cumulative count of Article Views (full-text article views including HTML views, PDF and ePub downloads, according to the available data) and Abstracts Views on Vision4Press platform.
Data correspond to usage on the plateform after 2015. The current usage metrics is available 48-96 hours after online publication and is updated daily on week days.
Initial download of the metrics may take a while.