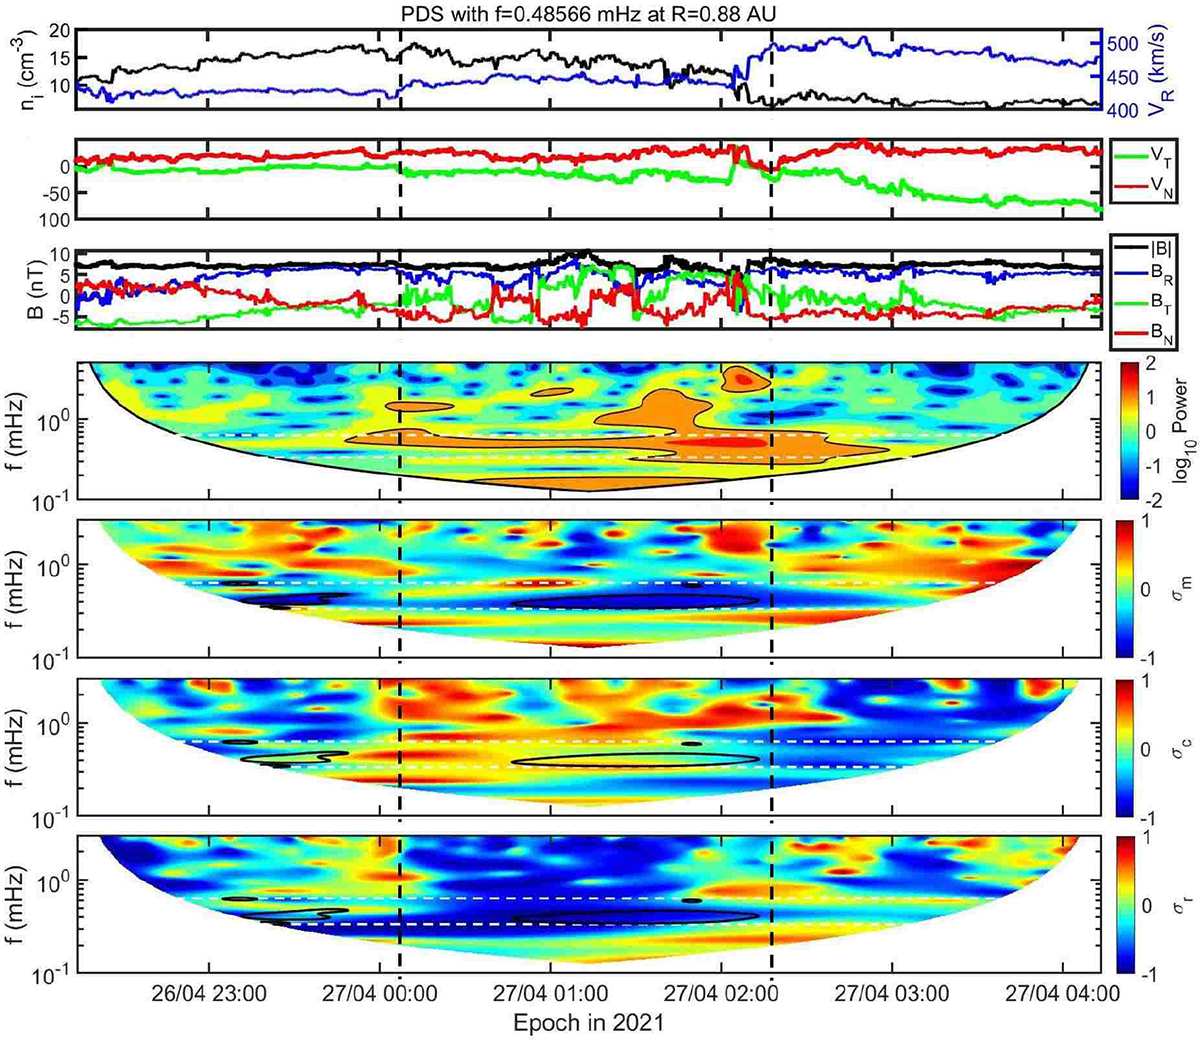
Fig. 1.
Download original image
Example of a helical structure (HS) observed by Solar Orbiter on April 27, 2021. From top to bottom: Total ion density and solar wind radial speed (VR) in black and blue, respectively; the transverse and normal component (VT and VN) of the solar wind speed; the Radial-Transverse-Normal (RTN) component of the interplanetary magnetic field along with |B|; the wavelet spectrum of the total ion density; spectrogram of the normalized reduced magnetic helicity, σm; spectrogram of the normalized cross helicity, σc; and spectrogram of the normalized residual energy, σr. The vertical black and the dashed horizontal white lines denote the PDS start and end time and the fPDS ± 0.15 mHz range, respectively. The black contour in the wavelet spectrum corresponds to the wavelet power threshold (see also Katsavrias et al. 2026 for more details). The black contour in the σm, σc, and σr panels corresponds to |σm| = 0.7.
Current usage metrics show cumulative count of Article Views (full-text article views including HTML views, PDF and ePub downloads, according to the available data) and Abstracts Views on Vision4Press platform.
Data correspond to usage on the plateform after 2015. The current usage metrics is available 48-96 hours after online publication and is updated daily on week days.
Initial download of the metrics may take a while.