Open Access
Fig. 2.
Download original image
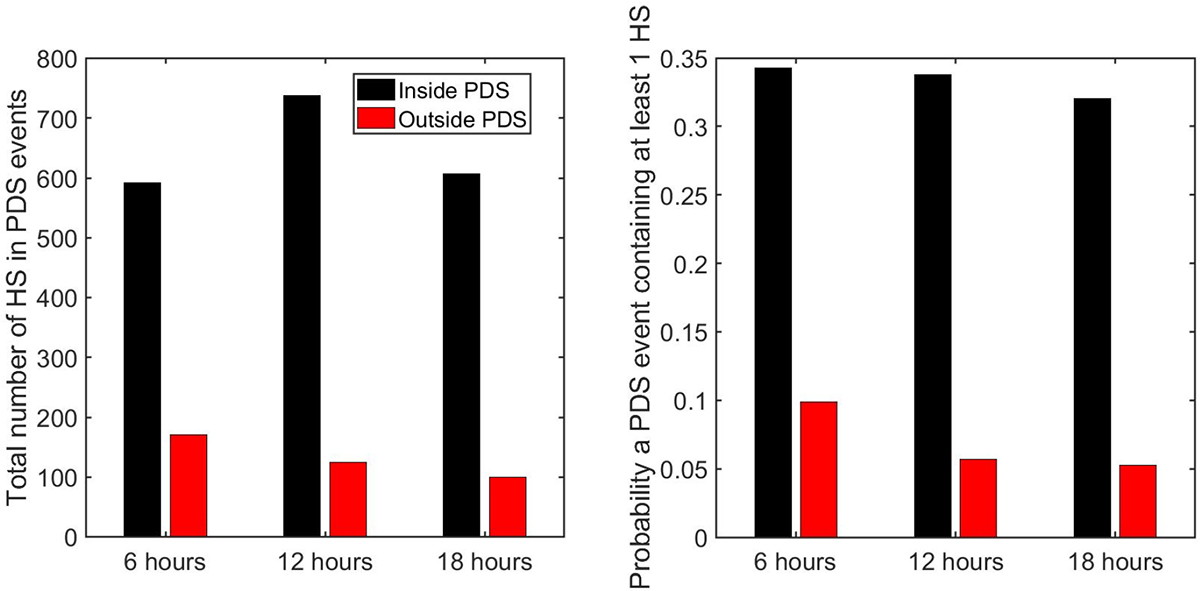
Total number (left panel) and percentage (right panel) of PDS events containing at least one helical structure (HS) within (black bars) and outside (red bars) the PDS start and end time limits for the window intervals of 6, 12, and 18 hours, respectively.
Current usage metrics show cumulative count of Article Views (full-text article views including HTML views, PDF and ePub downloads, according to the available data) and Abstracts Views on Vision4Press platform.
Data correspond to usage on the plateform after 2015. The current usage metrics is available 48-96 hours after online publication and is updated daily on week days.
Initial download of the metrics may take a while.