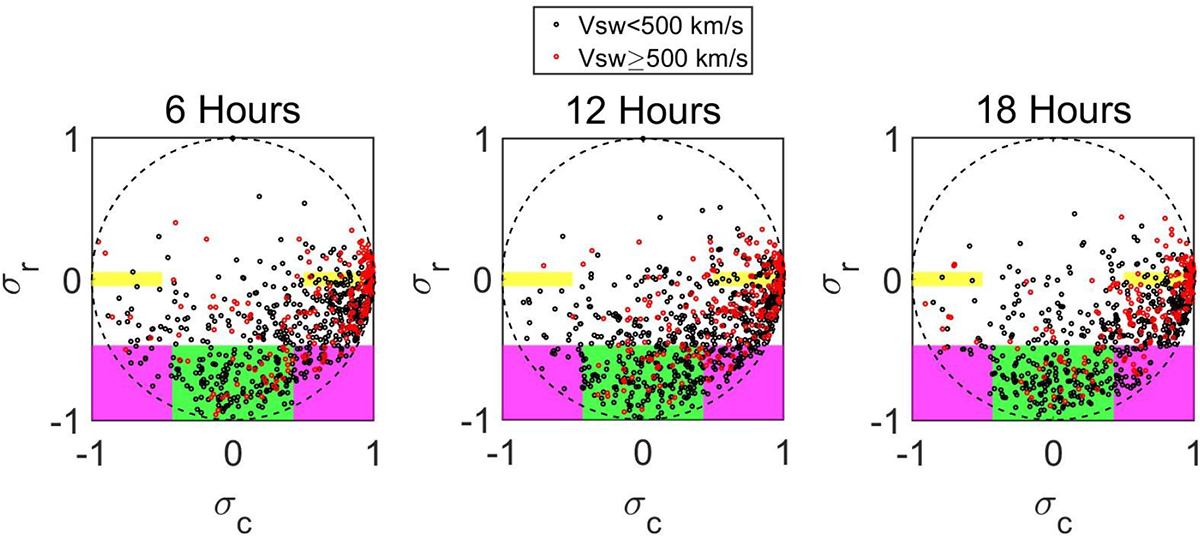
Fig. 3.
Download original image
Normalized residual energy (σr) vs. normalized cross helicity (σc) for all HSs with |σm|≥0.7 within the < 1 mHz PDS events in out list. The HSs are color-coded based on the average solar wind speed, with black and red circles corresponding to Vsw < 500 km/s and Vsw ≥ 500 km/s, respectively. The shaded green, yellow, and magenta areas represent the regions that likely contain flux ropes, Alfvénic HSs, and complex HSs, respectively.
Current usage metrics show cumulative count of Article Views (full-text article views including HTML views, PDF and ePub downloads, according to the available data) and Abstracts Views on Vision4Press platform.
Data correspond to usage on the plateform after 2015. The current usage metrics is available 48-96 hours after online publication and is updated daily on week days.
Initial download of the metrics may take a while.