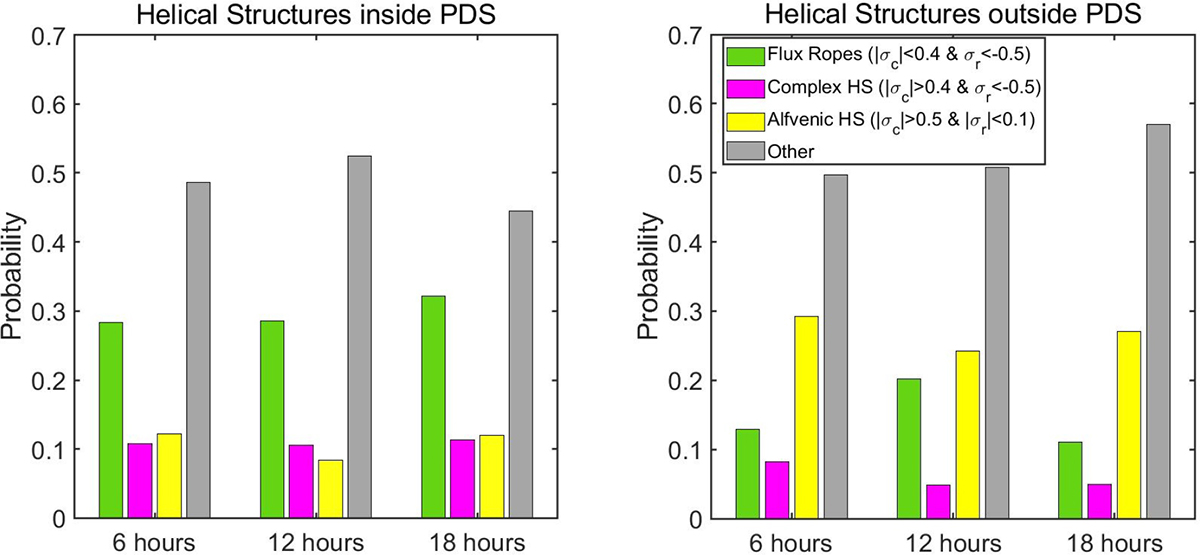
Fig. 4.
Download original image
Occurrence probability with respect to the total HS number for the various HS types detected inside (left panel) and outside (right panel) of the PDS start and end time limits. The HS are colored similarly to the shaded areas in Fig. 3, with green, magenta and yellow bars corresponding to flux ropes, complex events, and Alfvénic HSs, respectively.
Current usage metrics show cumulative count of Article Views (full-text article views including HTML views, PDF and ePub downloads, according to the available data) and Abstracts Views on Vision4Press platform.
Data correspond to usage on the plateform after 2015. The current usage metrics is available 48-96 hours after online publication and is updated daily on week days.
Initial download of the metrics may take a while.