Open Access
Fig. 5.
Download original image
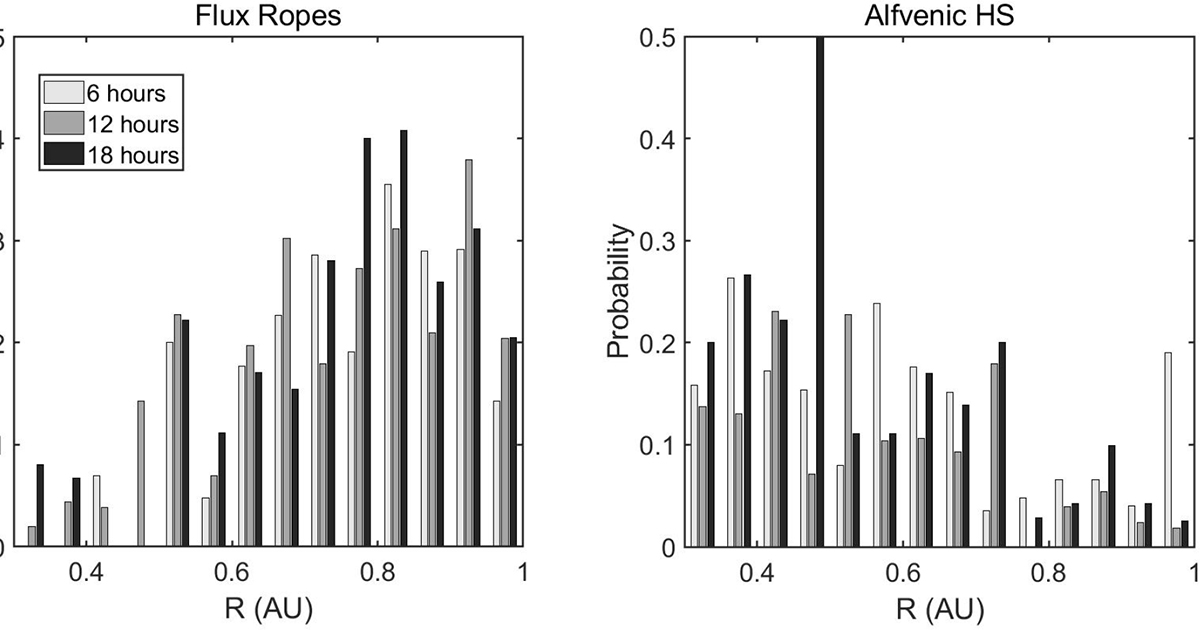
Occurrence probability normalized with respect to the total HS number in each bin vs. the heliocentric distance of the flux ropes (left panel) and Alfvénic HSs (right panel) detected within the PDS start and end time limits.
Current usage metrics show cumulative count of Article Views (full-text article views including HTML views, PDF and ePub downloads, according to the available data) and Abstracts Views on Vision4Press platform.
Data correspond to usage on the plateform after 2015. The current usage metrics is available 48-96 hours after online publication and is updated daily on week days.
Initial download of the metrics may take a while.