Open Access
Fig. 2
Download original image
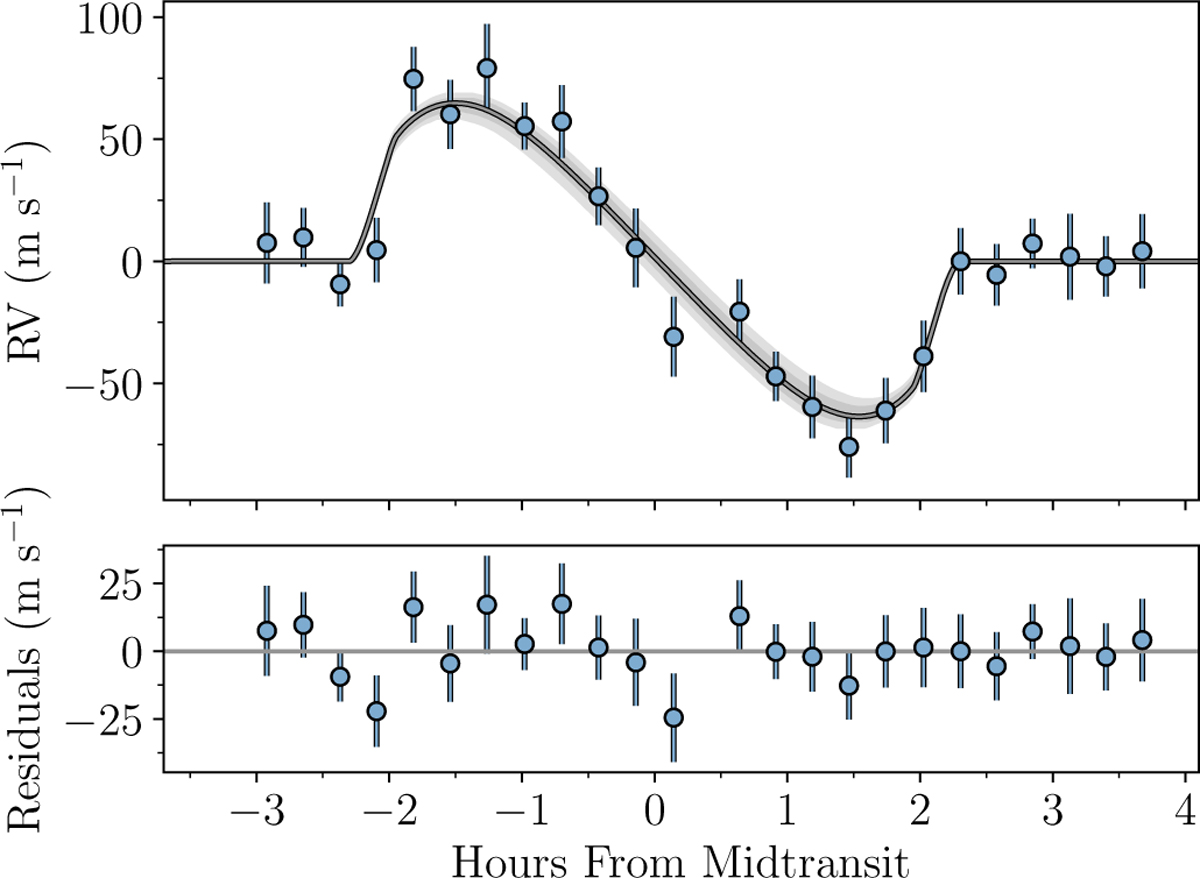
FIES RVs of TOI-1333A after subtracting the best-fitting Keplerian. The solid line denotes the best-fitting model for the RM effect, and the shaded areas represent the 1- and 2-σ confidence intervals.
Current usage metrics show cumulative count of Article Views (full-text article views including HTML views, PDF and ePub downloads, according to the available data) and Abstracts Views on Vision4Press platform.
Data correspond to usage on the plateform after 2015. The current usage metrics is available 48-96 hours after online publication and is updated daily on week days.
Initial download of the metrics may take a while.