Open Access
Fig. B.2
Download original image
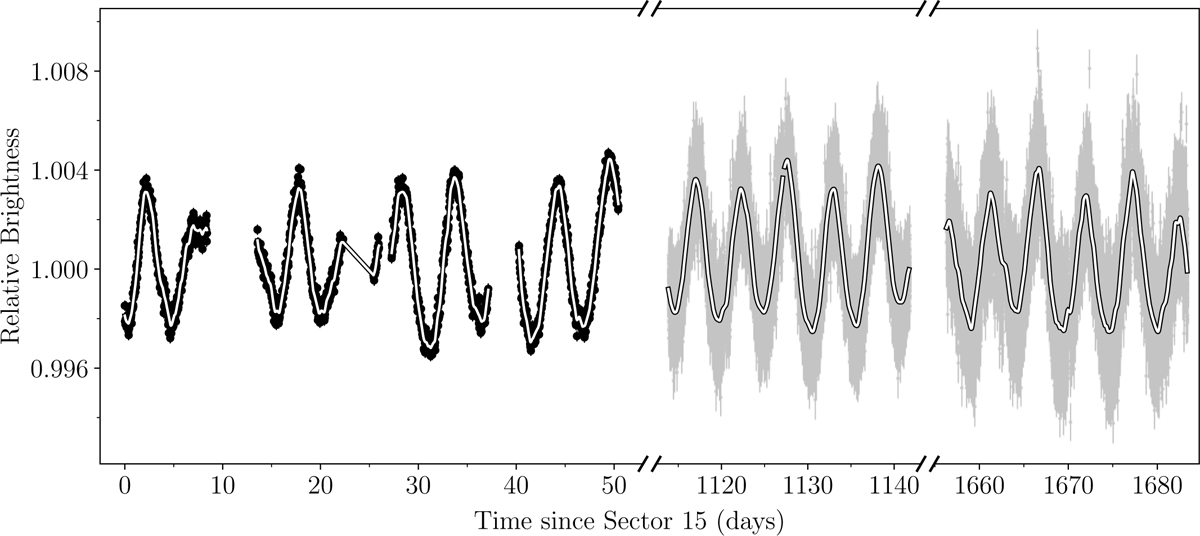
TESS light curves of TOI-1333 showing the rotational modulation, which cannot necessarily be attributed to TOI-1333A. The colourcoding is the same as in Figure 1. The GP model used for detrending is shown as the white line with a black outline. Transits were removed by subtracting the best-fitting transit model.
Current usage metrics show cumulative count of Article Views (full-text article views including HTML views, PDF and ePub downloads, according to the available data) and Abstracts Views on Vision4Press platform.
Data correspond to usage on the plateform after 2015. The current usage metrics is available 48-96 hours after online publication and is updated daily on week days.
Initial download of the metrics may take a while.