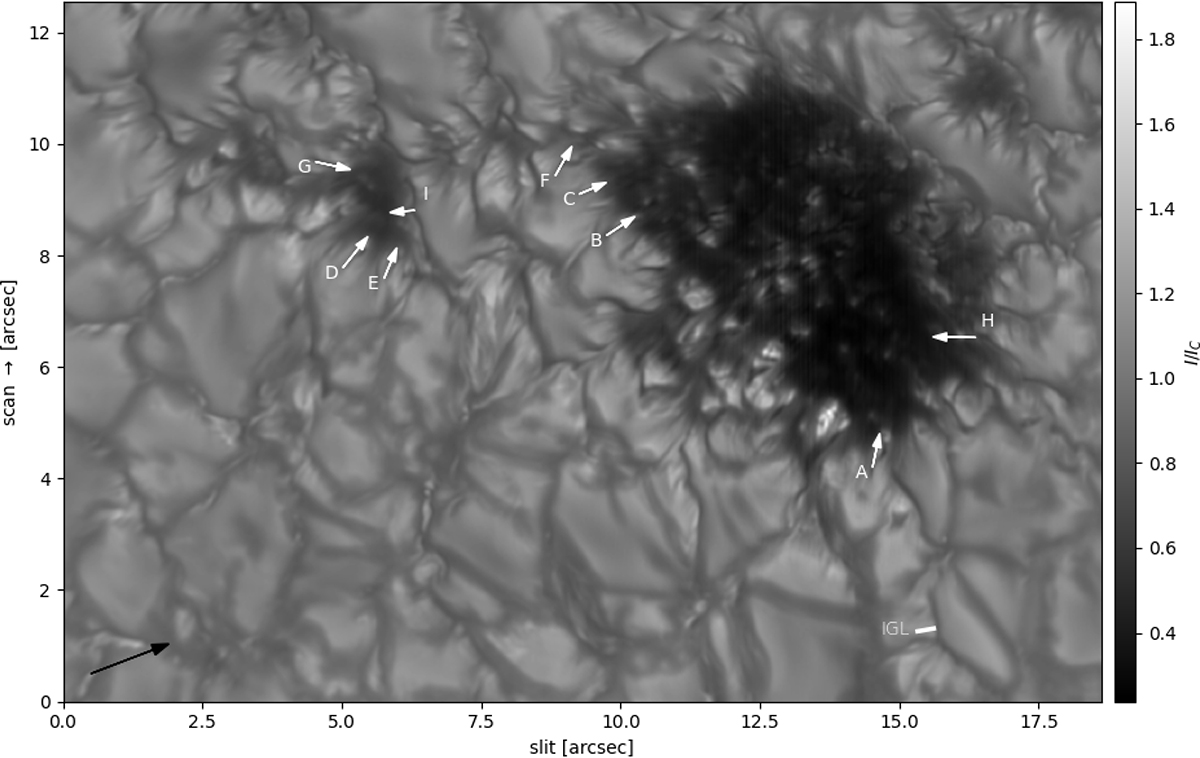
Fig. 1.
Download original image
Continuum scan-image constructed from MOMFBD (van Noort et al. 2005) reconstructed slit positions from the FISS-SP context imager. The white arrows indicate striations that formed grains during the observation and indicate the movement direction of the grain. The labels correspond to the panels in Figure 2. The black arrow indicates the direction of the disk center.
Current usage metrics show cumulative count of Article Views (full-text article views including HTML views, PDF and ePub downloads, according to the available data) and Abstracts Views on Vision4Press platform.
Data correspond to usage on the plateform after 2015. The current usage metrics is available 48-96 hours after online publication and is updated daily on week days.
Initial download of the metrics may take a while.