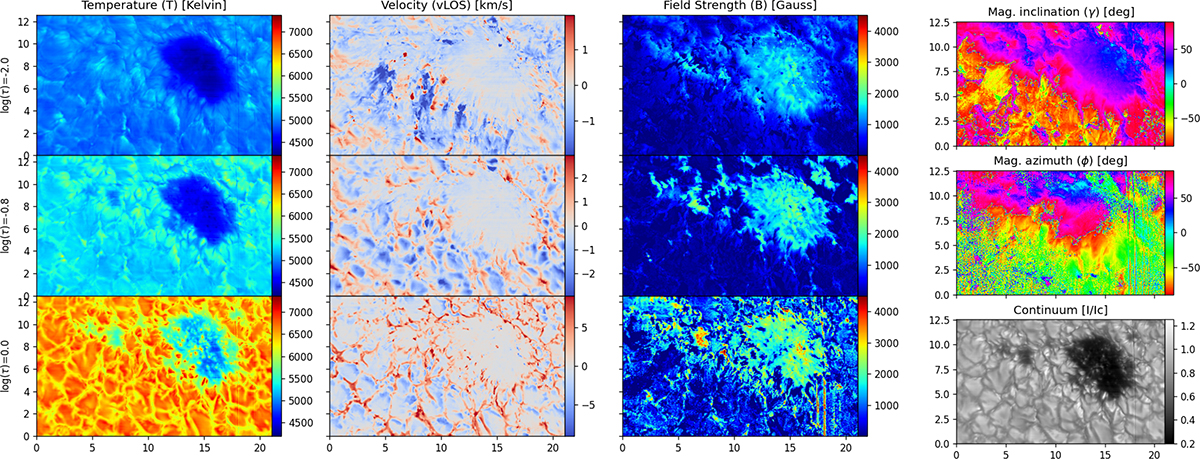
Fig. A.3.
Download original image
Maps of the inverted atmosphere similar to Hölken et al. (2026), Figure 7 but with an extended FOV. Here, the lower right panel shows a continuum image. In all figures negative VLOS denote a flow towards the observer (i.e., up-flow) and positive LOS velocities denote a flow away from the observer (i.e., down-flow). Disk-centre is towards the upper right.
Current usage metrics show cumulative count of Article Views (full-text article views including HTML views, PDF and ePub downloads, according to the available data) and Abstracts Views on Vision4Press platform.
Data correspond to usage on the plateform after 2015. The current usage metrics is available 48-96 hours after online publication and is updated daily on week days.
Initial download of the metrics may take a while.