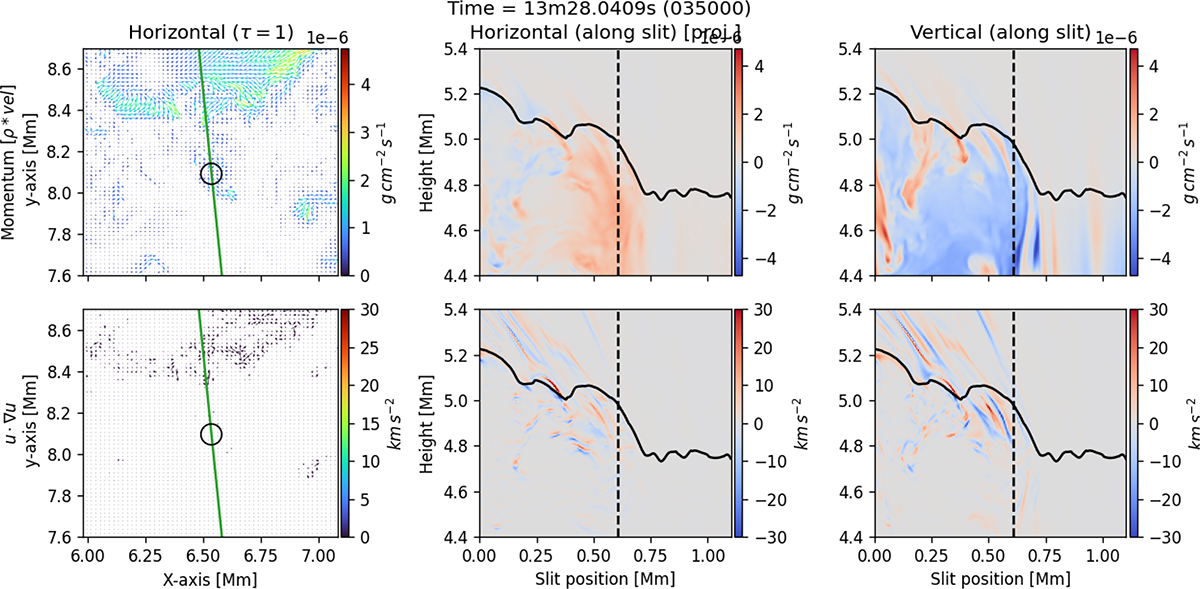
Fig. B.4.
Download original image
Momentum along the slit for the grain shown in Figure B.2. Upper row shows the momentum, lower row the non-linear part. Left column shows horizontal parts within the log(τ) = 0-surface, the green line indicates the slit plane with the grain marked by the black circle. Middle column shows horizontal part, projected onto the slit plane, right column the vertical part. The black solid line indicates the log(τ) = 0-surface and the vertical black dashed lines marks the grain position. The positive horizontal momentum is pointing towards the pore on the right and negative vertical momentum is pointing upwards.
Current usage metrics show cumulative count of Article Views (full-text article views including HTML views, PDF and ePub downloads, according to the available data) and Abstracts Views on Vision4Press platform.
Data correspond to usage on the plateform after 2015. The current usage metrics is available 48-96 hours after online publication and is updated daily on week days.
Initial download of the metrics may take a while.