Fig. 2.
Download original image
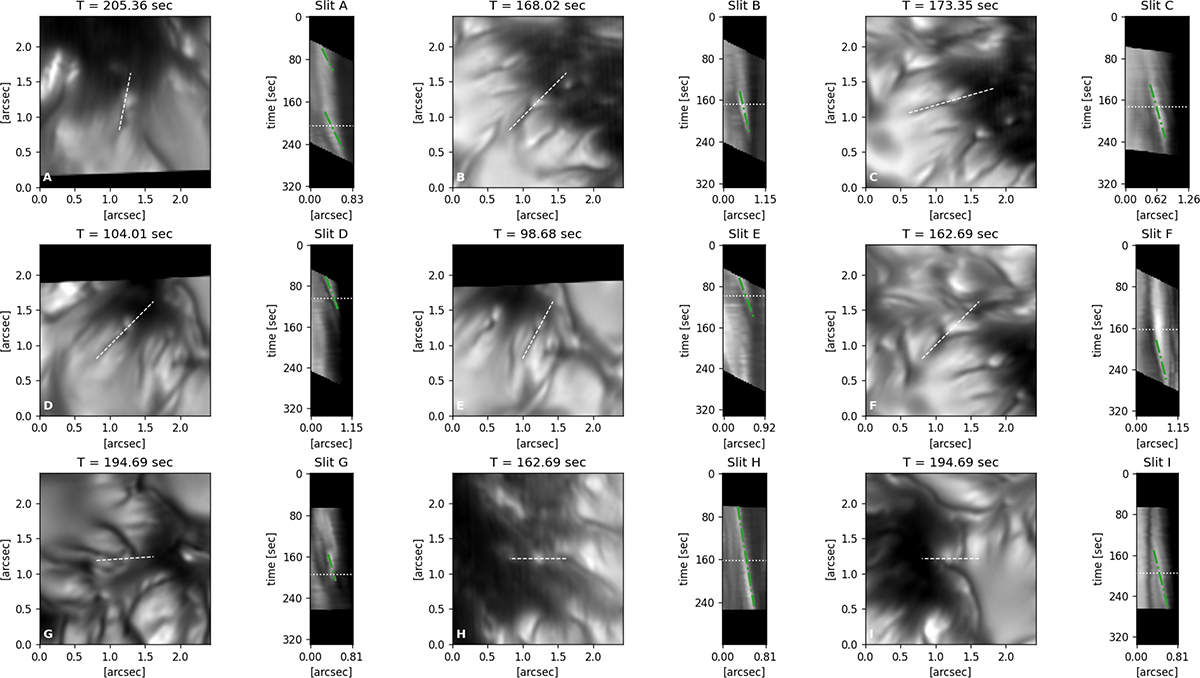
Overview of the nine striations hosting bright grains marked in Figure 1. Each striation is represented by a continuum- intensity image and a TDD. The latter was extracted along the dashed line indicated in the continuum image. The faint dotted line in the TDDs indicates the time of the adjacent context image, and the diagonal dash-dotted green lines track the observed grains in time along the slit. An animated version of this Figure is available as an online movie.
Current usage metrics show cumulative count of Article Views (full-text article views including HTML views, PDF and ePub downloads, according to the available data) and Abstracts Views on Vision4Press platform.
Data correspond to usage on the plateform after 2015. The current usage metrics is available 48-96 hours after online publication and is updated daily on week days.
Initial download of the metrics may take a while.