Fig. 3.
Download original image
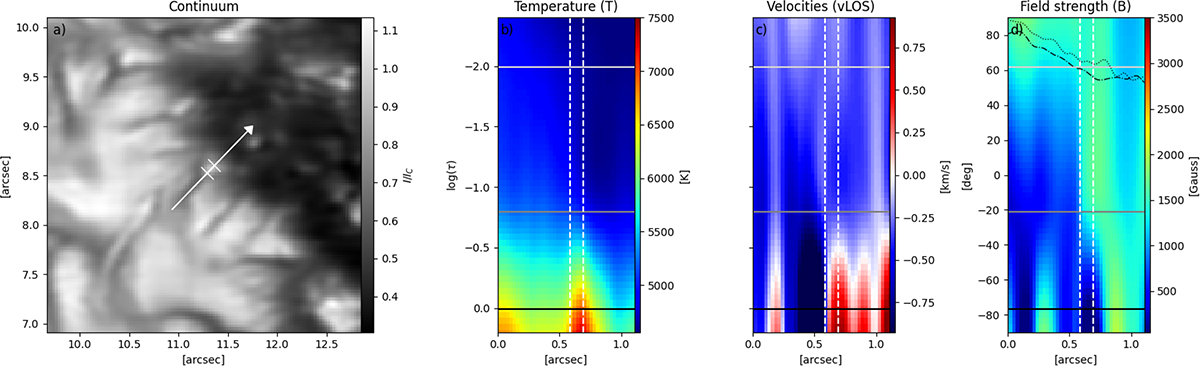
Stratification and context of bright Grain B. Panel (a) presents an FISS-SP integrated-intensity image from the restored scan. The white dashed line indicates the area shown in the other panels. The remaining three panels show cuts through (b) the temperature (T), (c) line-of-sight velocities (vLOS), and (d) field strength (B) stratification. The vertical axis of all three panels represents height in log(τ), indicated left of panel (b). The SPINOR nodes at log(τ) = 0.0, −0.8, and −2.0 are indicated with black, gray, and light gray horizontal lines respectively, and the beginning and end of the grain, based on the continuum image, is marked with white dashed vertical lines in panels b, c, and d, and with a white vertical line in panel (a). In panel (d) the dotted line indicates the azimuth angle, and the dash-dotted line indicates the inclination of the magnetic field corresponding to the y-axis of panel (d). Here, 0° is parallel to the LOS, and the value range is ± 90°. In all figures negative vLOS denotes a flow towards the observer (i.e., up-flow) and positive LOS velocities denote a flow away from the observer (i.e., downflow).
Current usage metrics show cumulative count of Article Views (full-text article views including HTML views, PDF and ePub downloads, according to the available data) and Abstracts Views on Vision4Press platform.
Data correspond to usage on the plateform after 2015. The current usage metrics is available 48-96 hours after online publication and is updated daily on week days.
Initial download of the metrics may take a while.